Question: an excel spreadsheet with your future cash flows and calculations and a one page word document describing your assumptions, findings, and interpretation of what your
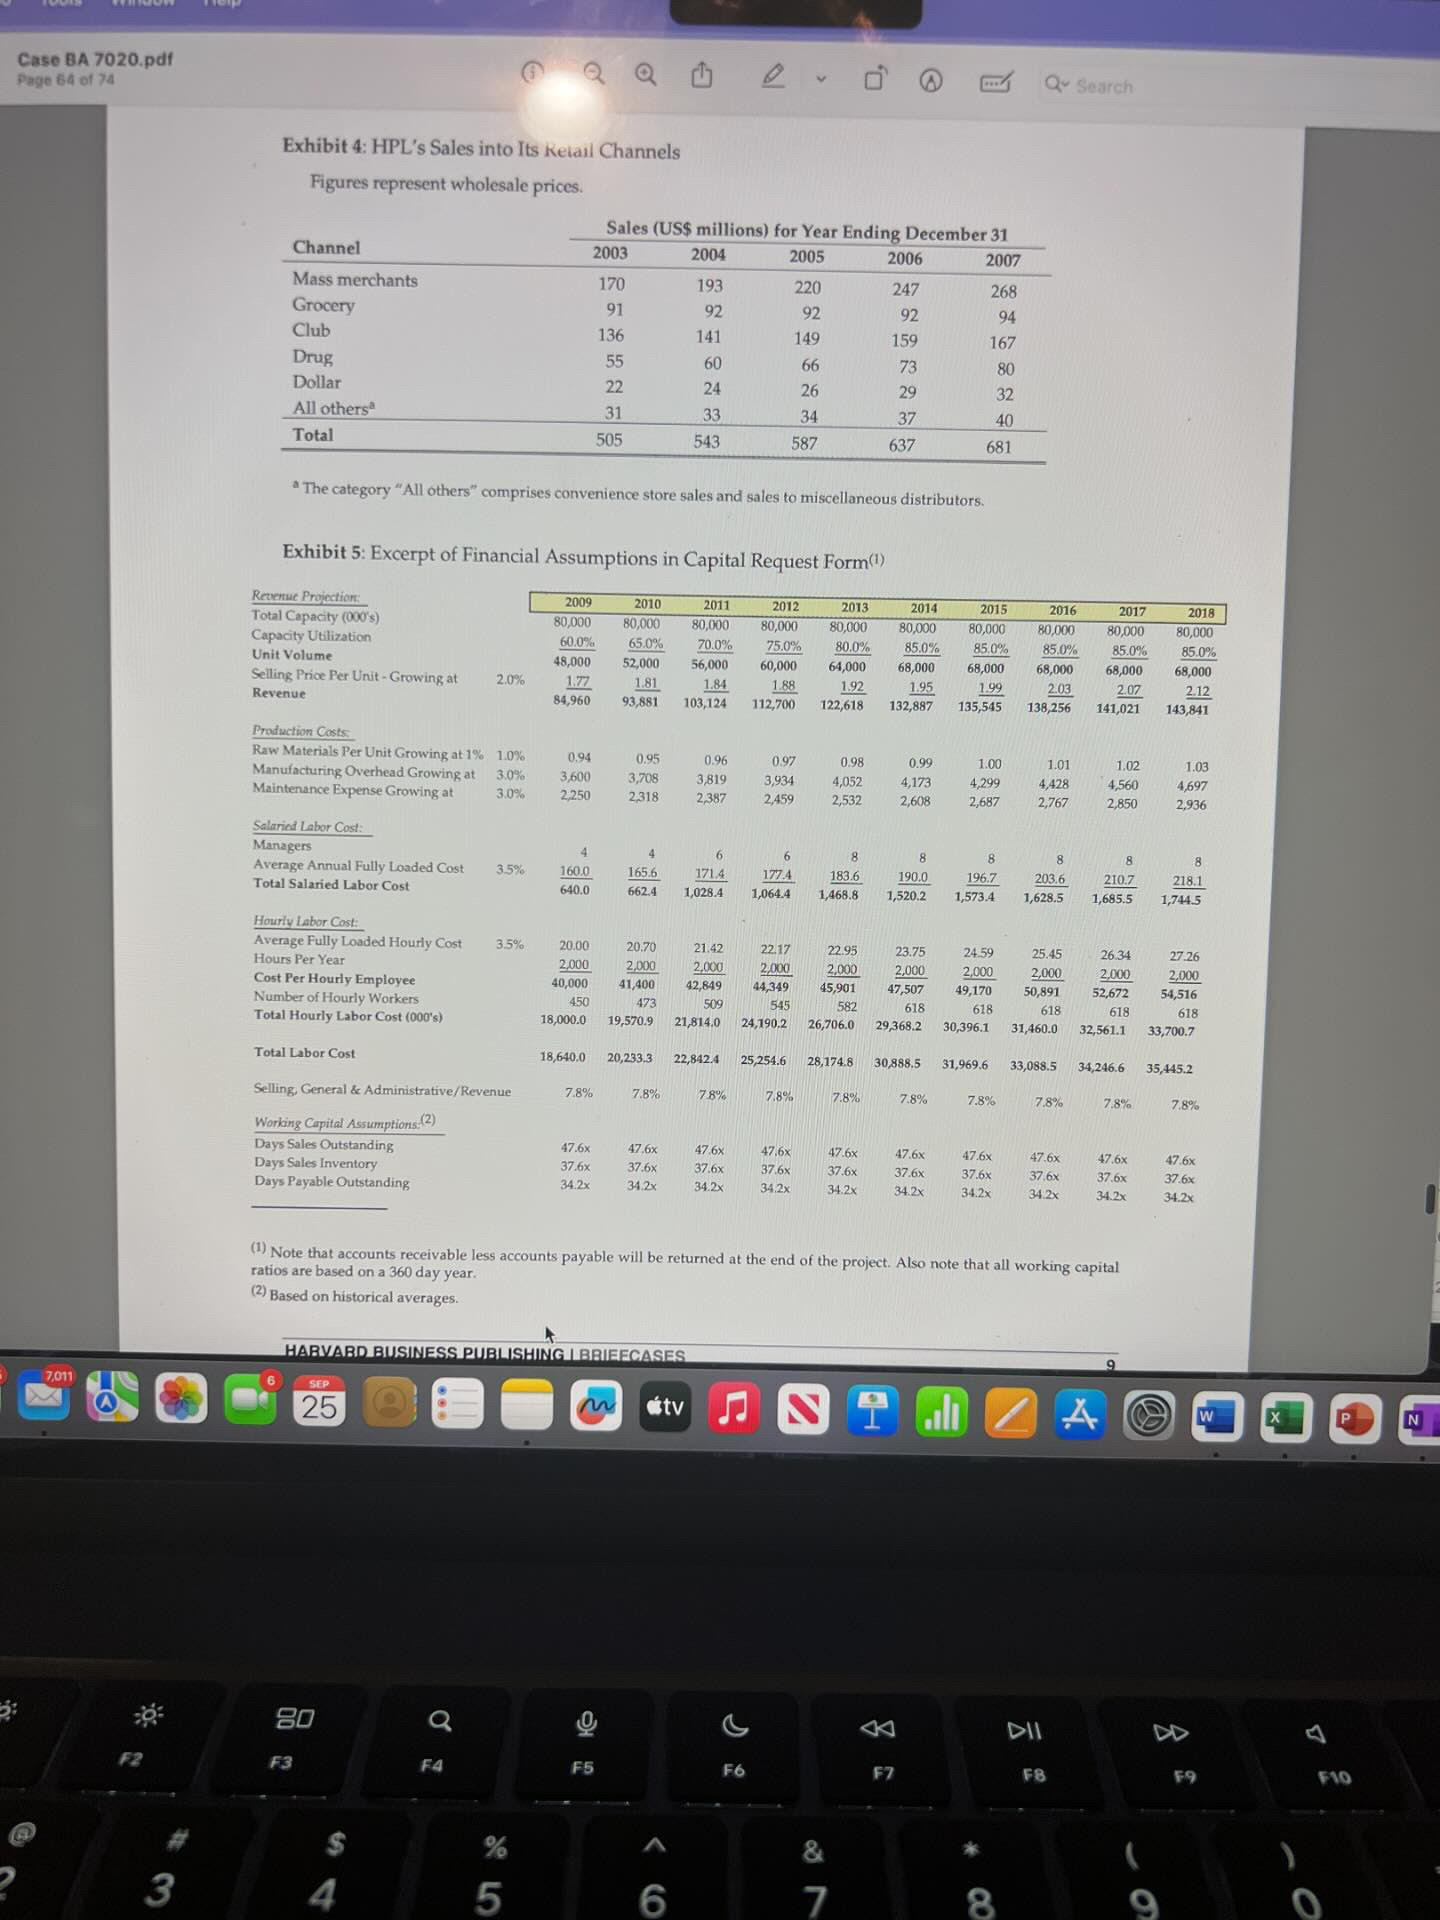
an excel spreadsheet with your future cash flows and calculations and a one page word document describing your assumptions, findings, and interpretation of what your findings mean to the company. use the photos provided it contains the case study
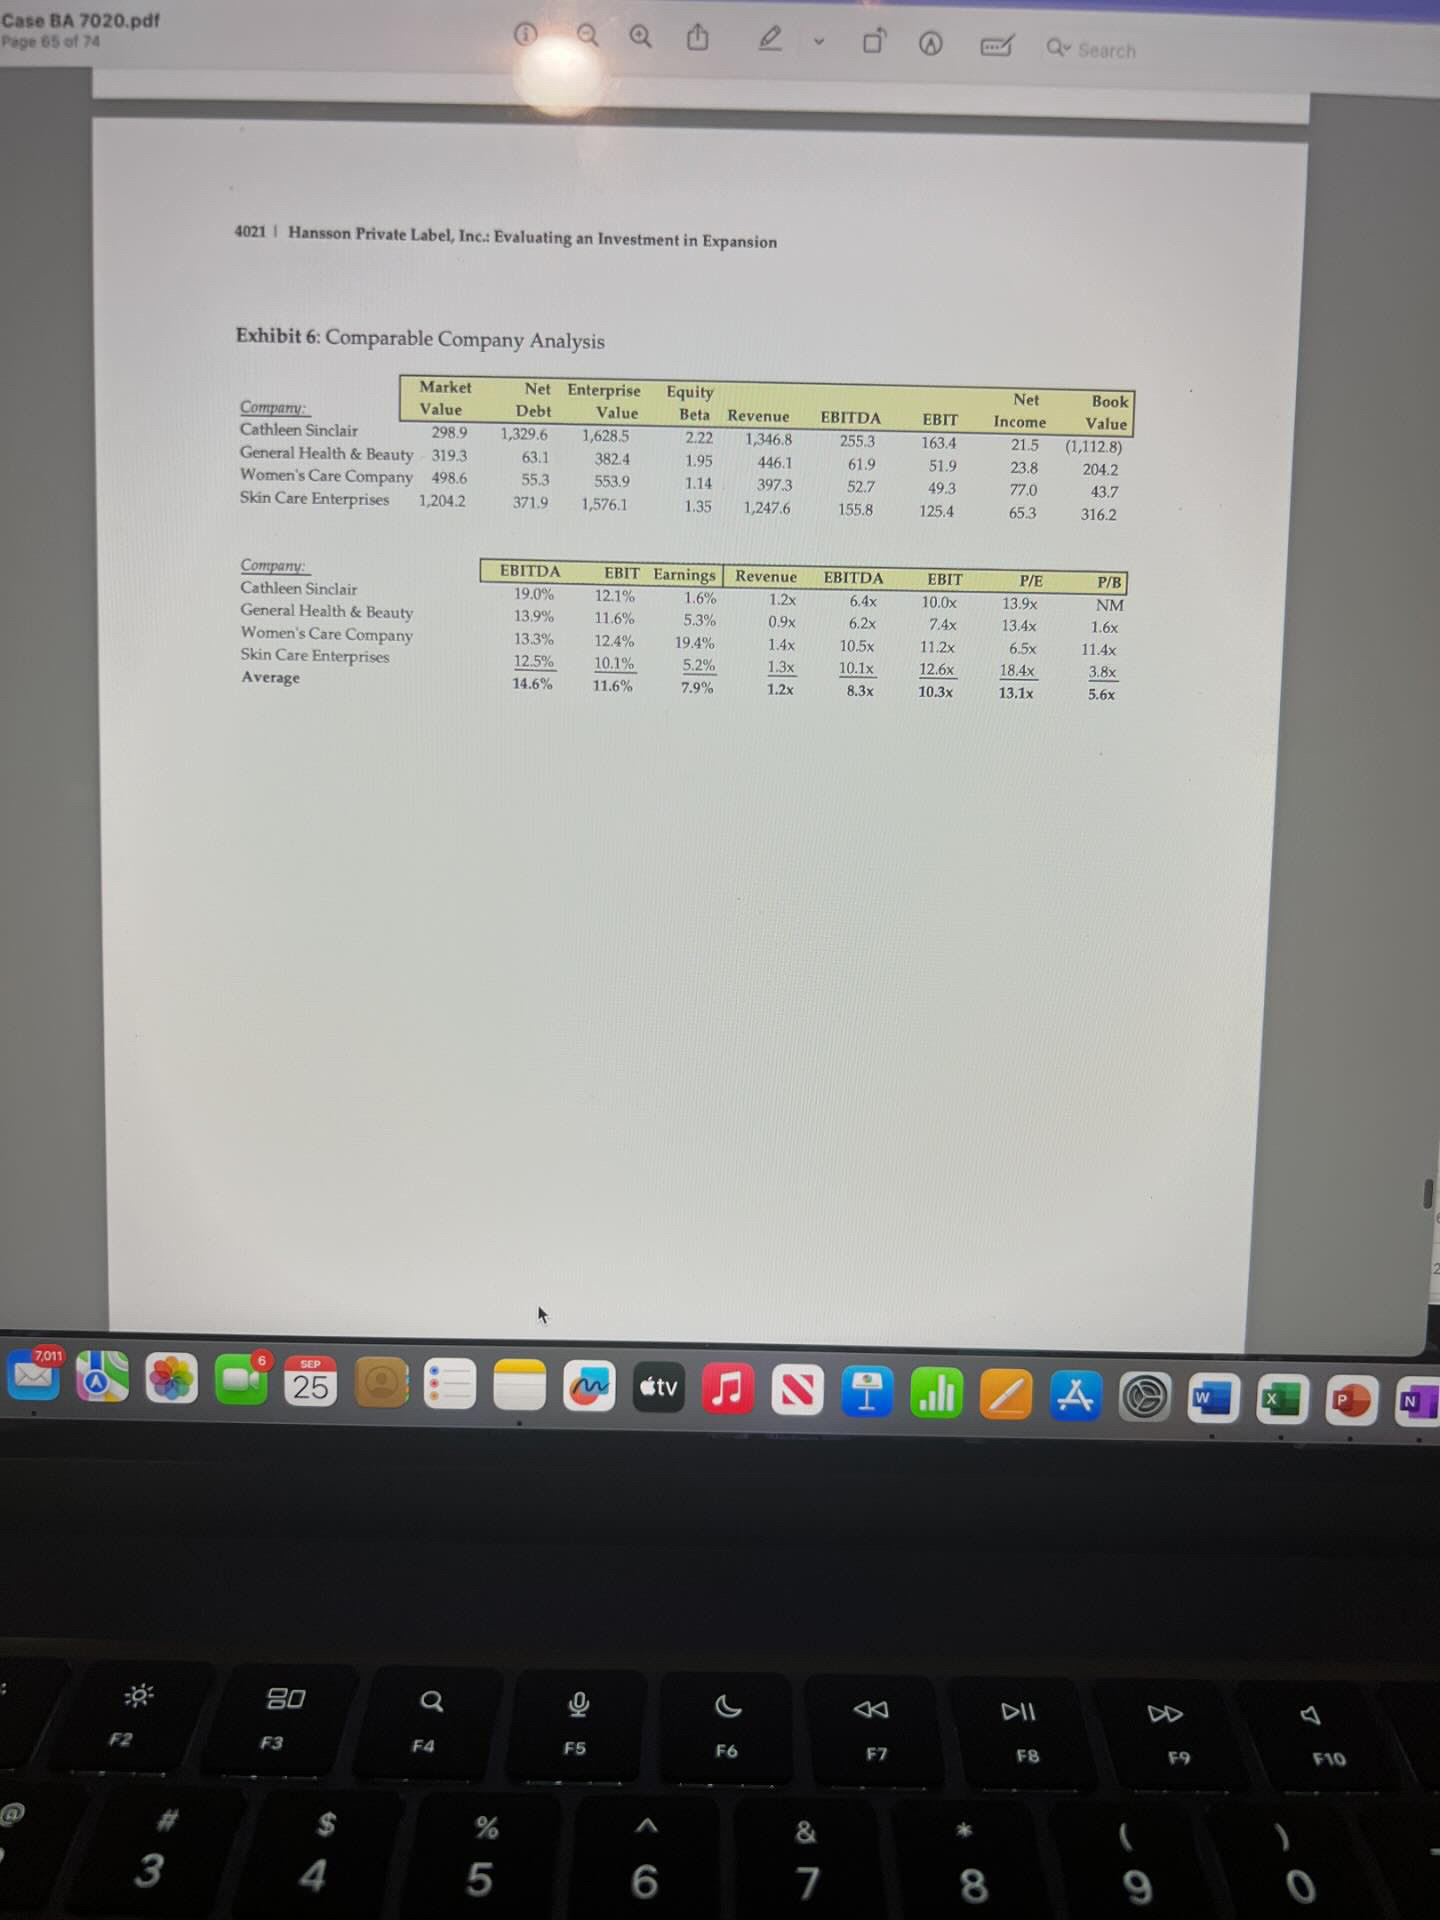
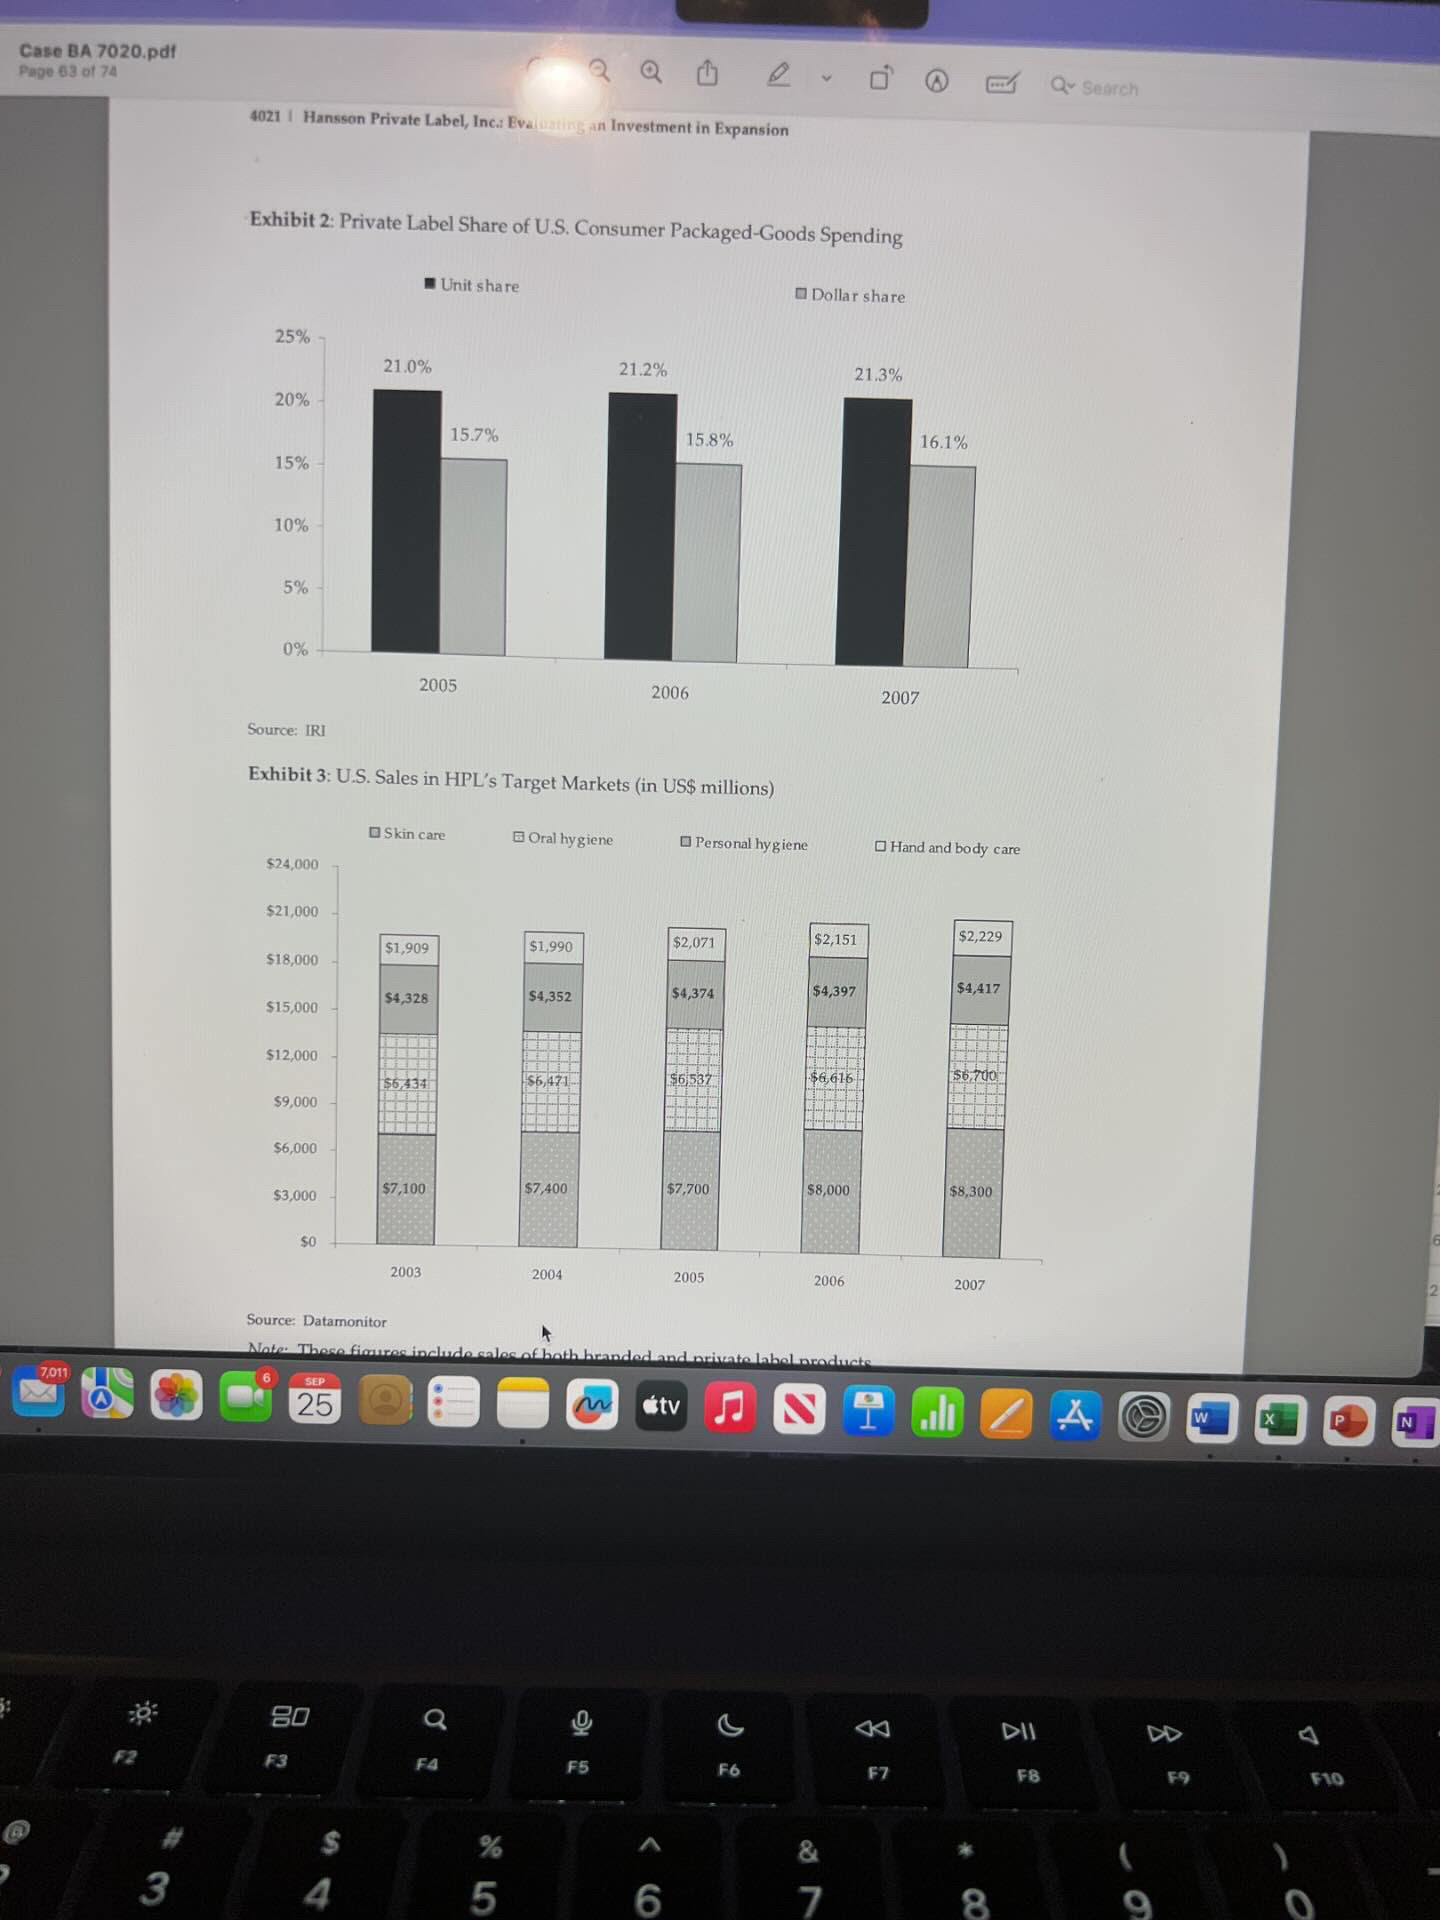
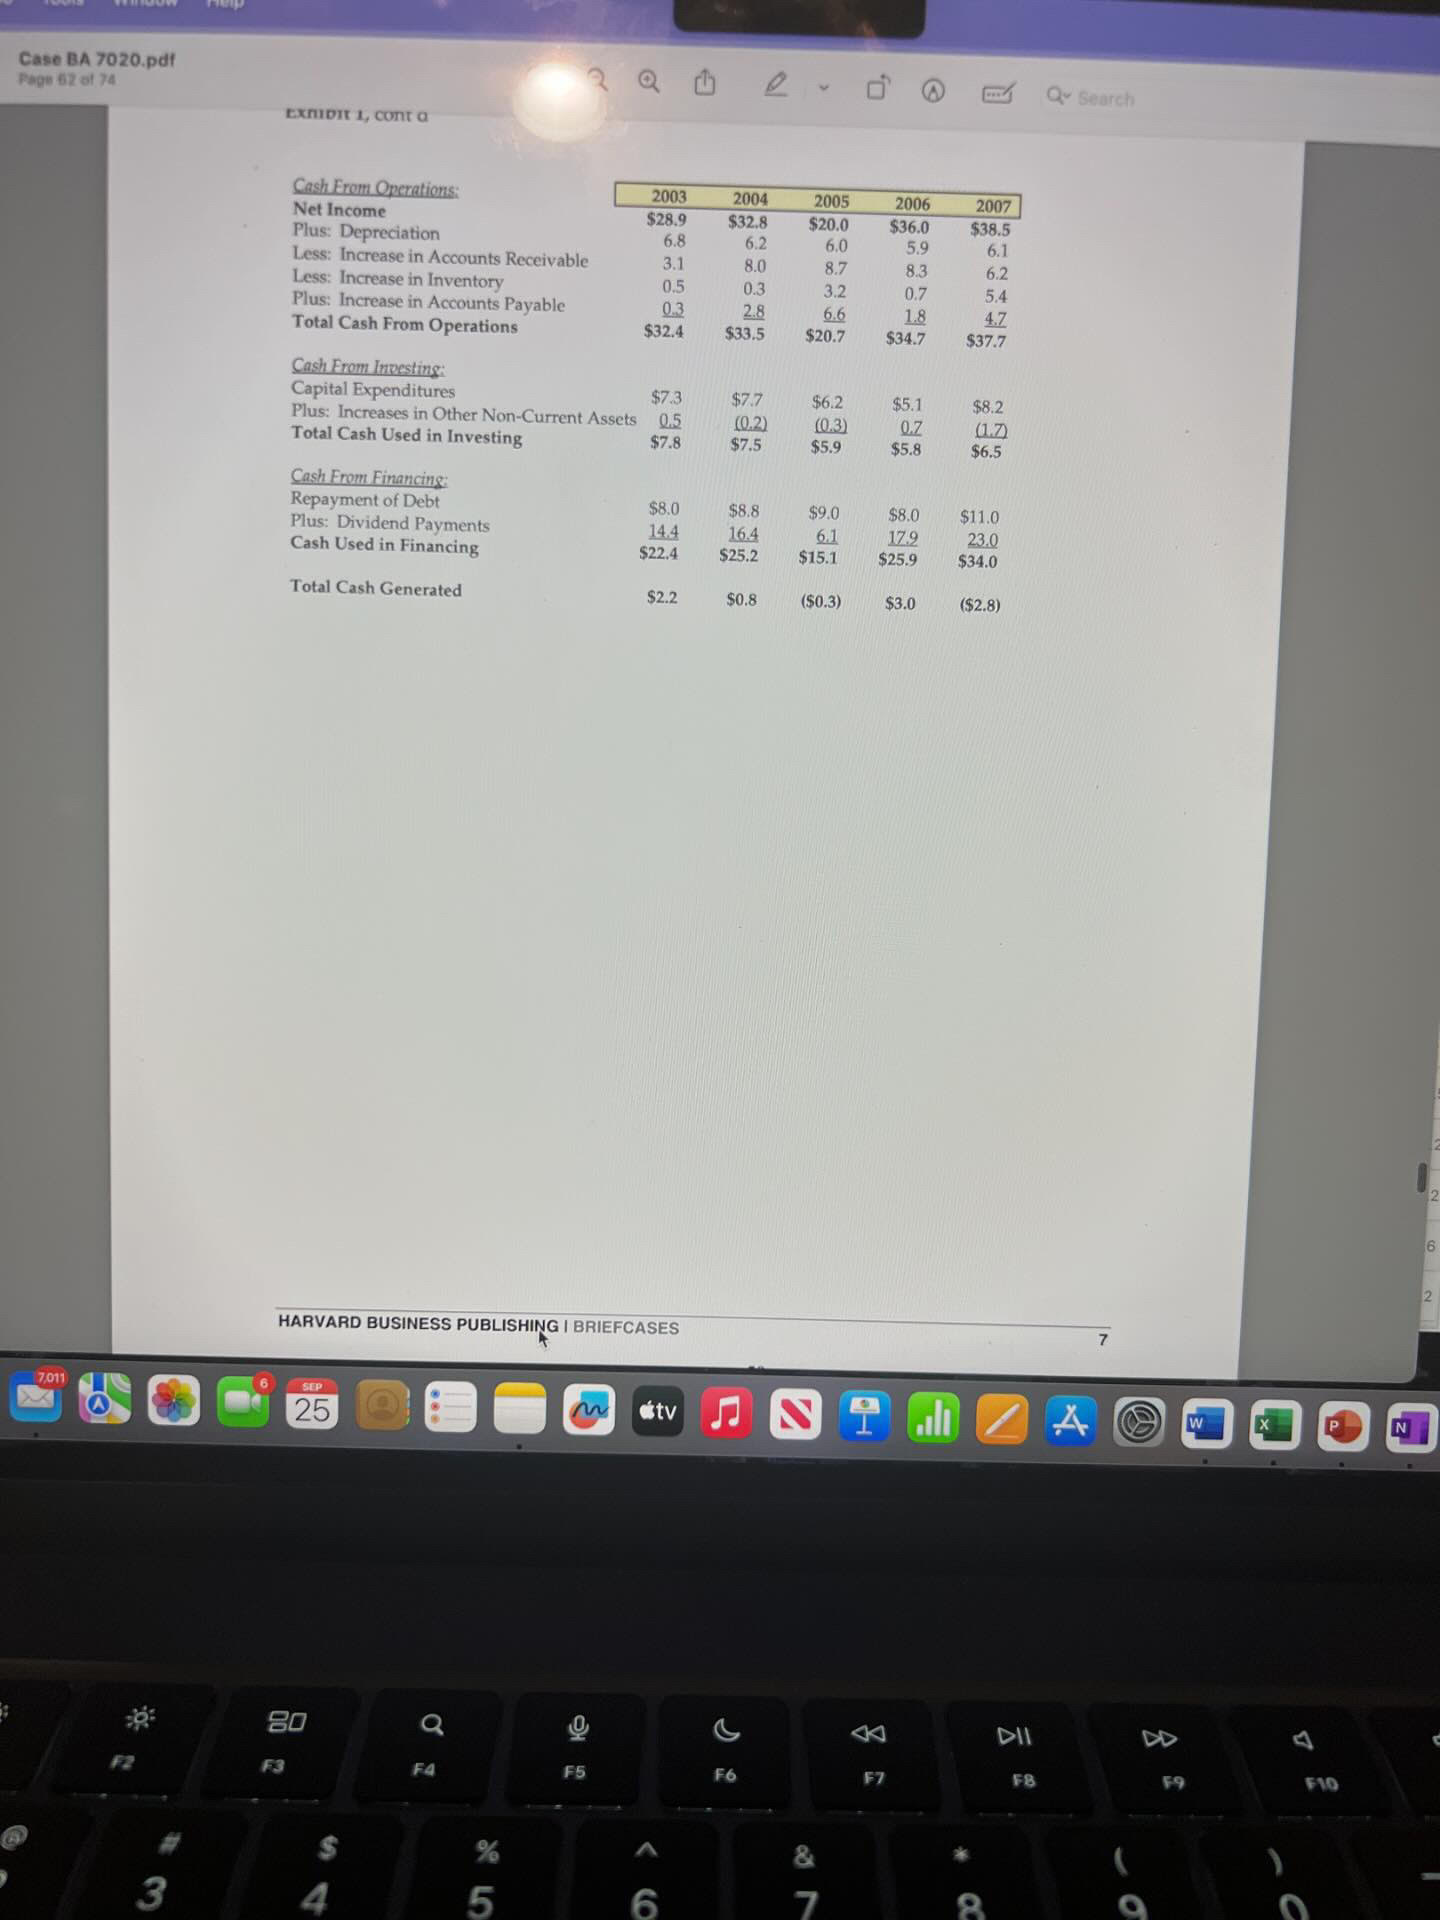
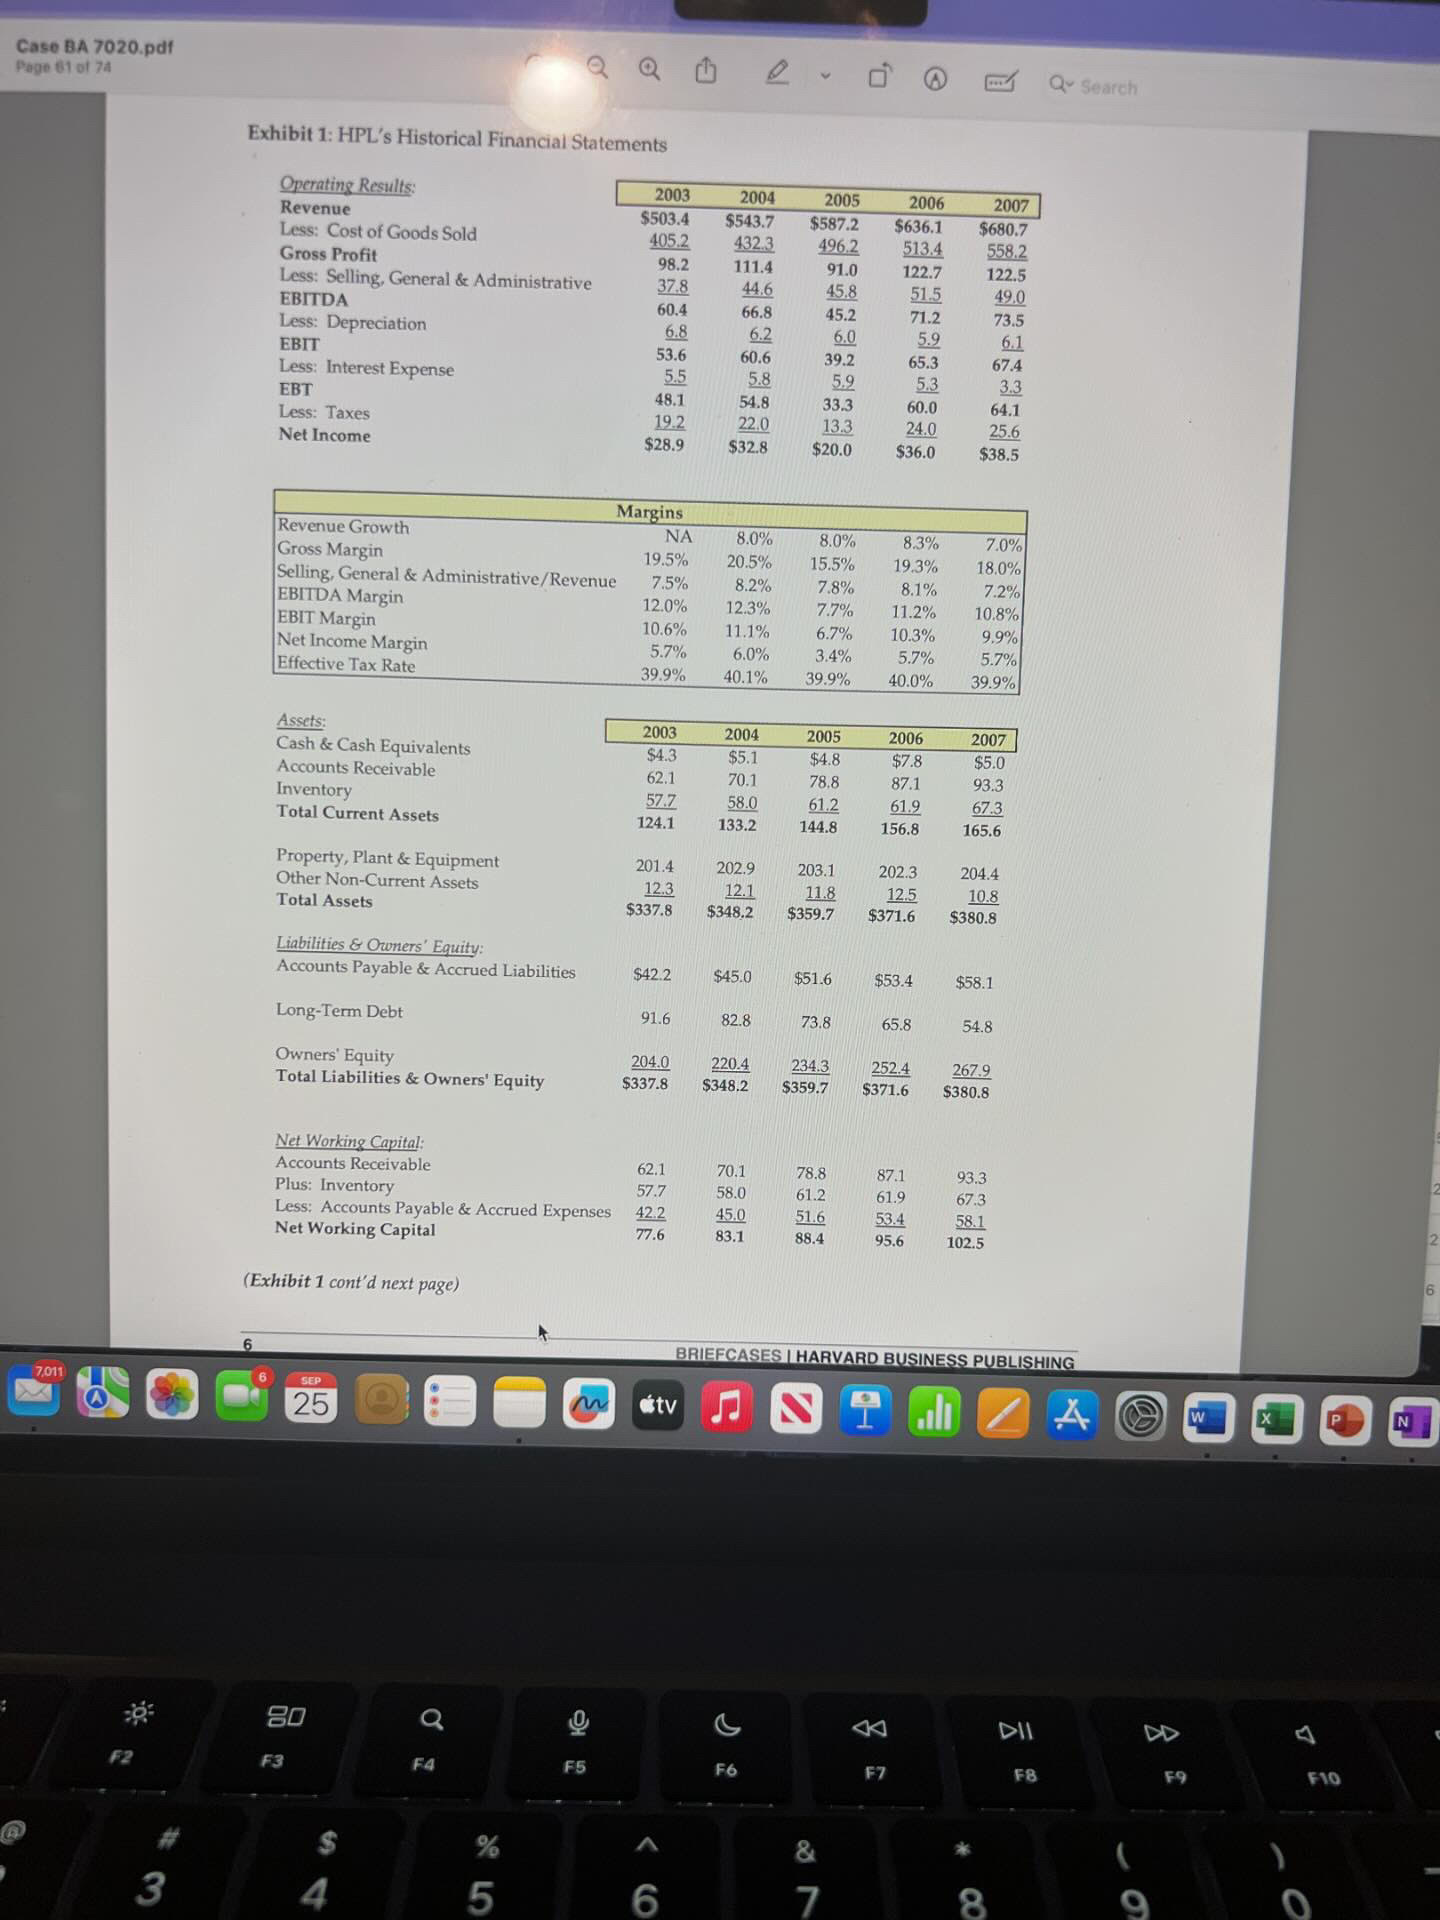
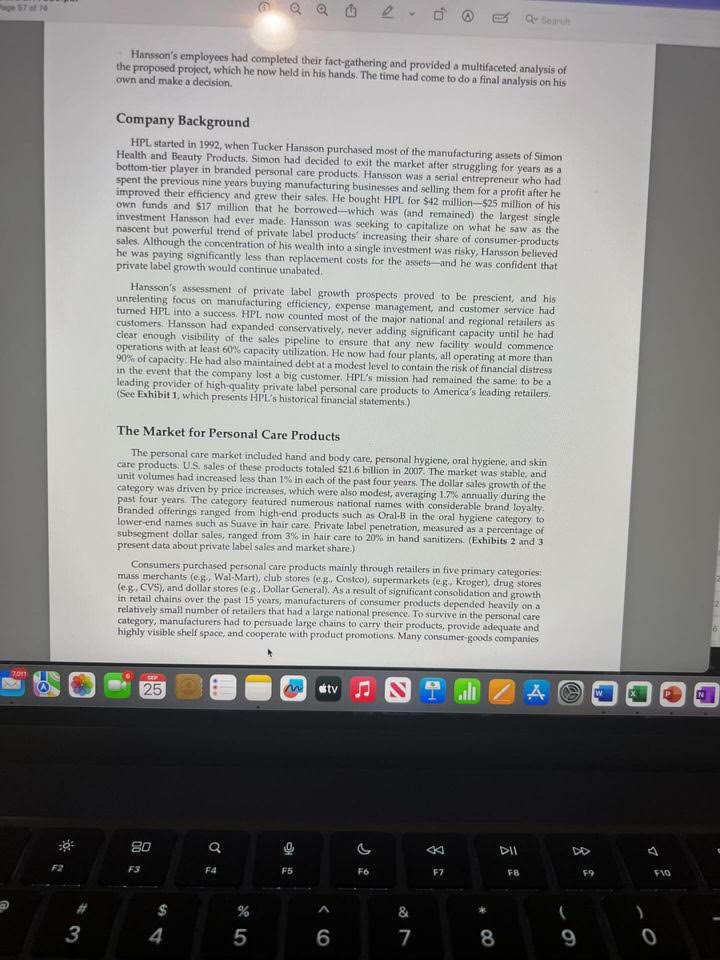
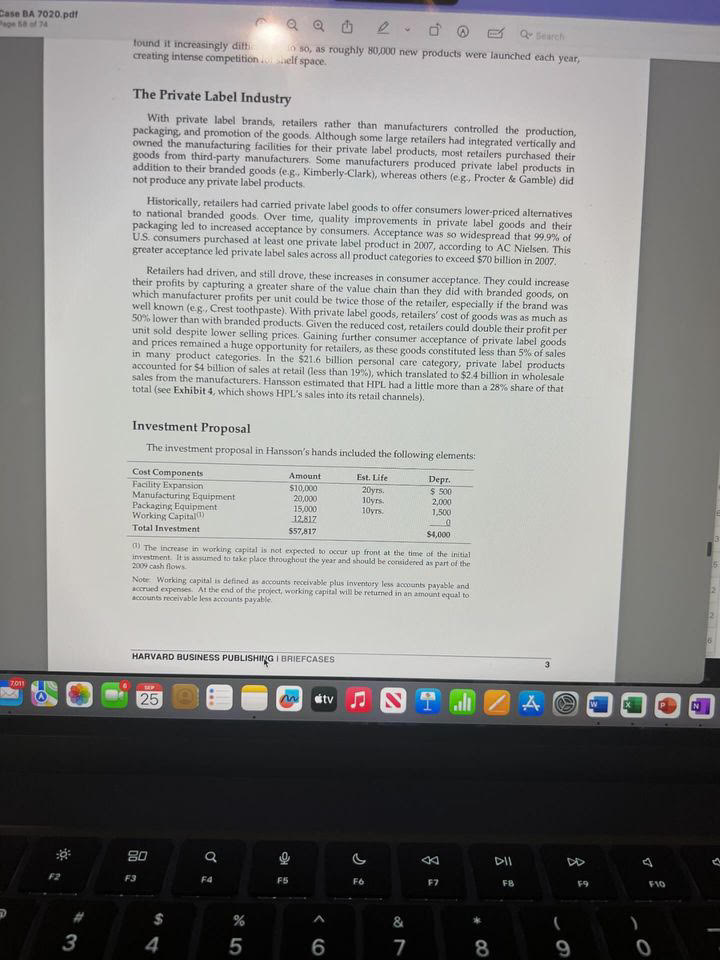
28 57 61 74 Hansson's employees had completed their fact-gathering and provided a multifaceted analysis of the proposed project, which he now held in his hands. The time had come to do a final analysis on his own and make a decision. Company Background HPL started in 1992, when Tucker Hansson purchased most of the manufacturing assets of Simon Health and Beauty Products, Simon had decided to exit the market after struggling for years as a bottom-tier player in branded personal care products, Hansson was a serial entrepreneur who had spent the previous nine years buying manufacturing businesses and selling them for a profit after he improved their efficiency and grew their sales. He bought HPL for $42 million-$25 million of his own funds and $17 million that he borrowed-which was (and remained) the Lairgest single investment Hansson had ever made. Hansson was seeking to capitalize on what he saw as the nascent but powerful trend of private label products' increasing their share of consumer-products sales. Although the concentration of his wealth into a single investment was risky, Hansson believed he was paying significantly less than replacement costs for the assets-and he was confident that private label growth would continue unabated. Hansson's assessment of private label growth prospects proved to be prescient, and his unrelenting focus on manufacturing efficiency, expense management, and customer service had turned HPL into a success. HPL now counted most of the major national and regional retailers as customers. Hansson had expanded conservatively, never adding significant capacity until he had clear enough visibility of the sales pipeline to ensure that any new facility would commence operations with at least 60% capacity utilization. He now had four plants, all operating at more than 90% of capacity. He had also maintained debt at a modest level to contain the risk of financial distress in the event that the company lost a big customer, HPL's mission had remained the same; to be a leading provider of high quality private label personal care products to America's leading retailers. (See Exhibit 1, which presents HPL's historical financial statements.) The Market for Personal Care Products The personal care market included hand and body care, personal hygiene, oral hygiene, and skin care products, U.S. sales of these products totaled $21.6 billion in 2007. The market was stable, and unit volumes had increased less than 1% in each of the past four years. The dollar sales growth of the category was driven by price increases, which were also modest, averaging 1.7% annually during the past four years. The category featured numerous national names with considerable brand loyalty Branded offerings ranged from high-end products such as Oral-B in the oral hygiene category to lower-end names such as Suave in hair care. Private label penetration, measured as a percentage of subsegment dollar sales, ranged from 3% in hair care to 20% in hand sanitizers. (Exhibits 2 and 3 present data about private label sales and market share.) Consumers purchased personal care products mainly through retailers in five primary categories: mass merchants (eg., Wal-Mart), club stores (e.g. Costco), supermarkets (e.g., Kroger), drug stores (e.g., CVS), and dollar stores (e.g., Dollar General). As a result of significant consolidation and growth in retail chains over the past 15 years, manufacturers of consumer products depended heavily on a relatively small number of retailers that had a large national presence. To survive in the personal care category, manufacturers had to persuade large chains to carry their products, provide adequate and highly visible shelf space, and cooperate with product promotions. Many consumer goods companies 7041 25 tv DIL DD F10 % 5 8 O 3 6 77020.pdf FRIX STAFFORD JOEL L. HEILPRIN THEPRRY DEVOLDER Hansson Private Label, Inc.: Evaluating an Investment in Expansion Introduction On a frigid Sunday night in late February 2008, Tucker Hansson pored over a proposal developed by his firm's manufacturing team. It called for investing $50 million to expand production capacity at Hansson Private Label (Hansson or HPL). For Hansson, a private company, this would be a significant investment. The company had not initiated a project of that magnitude for more than a decade, and the expansion wasn't without significant risk. It would be likely to double HPL's debt and to greatly increase customer concentration. This was a critical juncture for the firm Tucker Hansson had carefully built over 15 years. He wondered whether the return on investment would be large enough to justify the effort and risk. He also wondered about the best means of evaluating the potential investment. HPL manufactured personal care products-soap, shampoo, mouthwash, shaving cream, sunscreen, and the like all sold under the brand label of one or another of HPL's retail partners, which included supermarkets, drug stores, and mass merchants. The firm, whose sales had grown steadily over the years, generated $681 million in revenue in 2007. Three weeks earlier, HPL's largest retail customer had told Hansson that it wanted to significantly increase HPL's share of their private label manufacturing. Given that HPL was already operating near full capacity, it would need to expand to accommodate this important customer without 'cannibalizing" a significant portion of HPL's existing business. The rub was, the customer would commit to only a three-year contract-and it expected a goo-go commitment from Hansson within 30 days. Although he was worried about risk, Hansson was equally invigorated by the prospects of rapid growth and significant value creation. He knew of numerous examples of manufacturers, both in private label and branded businesses, who had risked their future by locking in a strong relationship with a huge, powerful retailer. For many, the bet had delivered a big payout that lasted for decades. HBS Professor Erik Stafford, Illinois Institute of Technology Adjunct Finance Professor Joel I Heilpain, and writer Jett Devolder prepared the case specifically for the Harvard Busingy Publishing Brief Case Collection. Though inspired by real events, the case does not represent a specific altuition at an existing company, and any nsemblance to actual persons or entitles is unintended. Cases are developed solely as the basis for class discussion and are not intended to serve as endorsements, sources of primary data, of illustrations of effective or ineffective management. Copyright @ 2009 Harvard Business Publishing. To order copies or request permission to reproduce materials, call 1-800-545-7685 or go to www.lbop harvard edu/educators. This publication may not be digitized, photocopied or otherwise reproduced, posted, or transmitted, without the permission of Harvard Business I'ublishing Harvard Business Publishing is an affiliate of Harvard Business School. 53 25 tv ONCase BA 7020.pdf . Q Q 1 2 - @ Q Search Page 65 of 74 4021 | Hansson Private Label, Inc.: Evaluating an Investment in Expansion Exhibit 6: Comparable Company Analysis Market Net Enterprise Equity Ne Book EBITDA EBIT Company Debt Beta Revenue Value Value Value Income 298.9 1,329.6 1,628.5 2.22 1,346.8 255,3 163.4 21.5 (1,112.8) Cathleen Sinclair 51.9 23.8 204.2 General Health & Beauty 319.3 63.1 382.4 1.95 446.1 61.9 Women's Care Company 498.6 55.3 553.9 1.14 397.3 52.7 49 3 77.0 43.7 371.9 1,576. 1.35 1,247.6 155.8 125.4 65.3 316.2 Skin Care Enterprises 1,204.2 Company EBITDA EBIT Earnings Revenue EBITDA EBIT P/E P/B Cathleen Sinclair 19.0% 12.1% 1.6% 1.2x 6.4x 10.0x 13.9x NM General Health & Beauty 13.9% 11.6% 5.3% 0.9x 6.2x 7.4x 13.4x 1.6x Women's Care Company 13.3% 12.4% 19.4% 1.4x 10.5x 11.2x 6.5x 11.4x 3.8x Skin Care Enterprises 12.5% 10.1% 5.2% 1.3x 10.1x 12.6x 18.4x 8.3x 10.3x 13.1x 5.6x Average 14.6% 11.6% 7.9% 1.2x 7,013 6 SEP 25 DD 20 O O K DII F10 CA C5 F6 F2 SS % & O 3 5 6Case BA 7020.pdf Page 83 of 74 Q Q 1 2 . ' @ E Qu search 4021 | Hansson Private Label, Inc.: Evaluating an Investment in Expansion Exhibit 2: Private Label Share of U.S. Consumer Packaged-Goods Spending Unit share Dollar share 25% 21.0% 21.2% 21.3% 20% 15.7% 15.8% 16.1% 15% 10% 5% 0% 2005 2006 2007 Source: IRI Exhibit 3: U.S. Sales in HPL's Target Markets (in US$ millions) Skin care Oral hygiene Personal hygiene OHand and body care $24,000 $21,000 $2,071 $2,151 $2,229 $1,909 $1,990 $18,000 $4,397 $4,417 $4,328 $4,352 $4,374 $15,000 $12,000 $6.616 56,434 -$6,471 $9,000 $6,000 $3,000 $7,100 $7,400 $7,700 $8,000 $8,300 2003 2004 2005 2006 2007 Source: Datamonitor Note include cales of both bran nd private label products 7,011 6 SEP 25 20 K DII DD 63 FA F6 F8 F9 $10 IS & 3 5 6Case BA 7020.pdf 2 Q D e - ' @ Qu Search Page 62 at 74 EXHIDIt 1, cont a Cash From Operations: 2003 2004 2005 2006 2007 Net Income $28.9 $32.8 $20.0 $36.0 $38.5 Plus: Depreciation 6.8 6.2 6.0 5.9 6.1 Less: Increase in Accounts Receivable 3.1 8.0 8.7 8.3 6.2 Less: Increase in Inventory 05 0.3 3.2 0.7 5.4 Plus: Increase in Accounts Payable 03 2.8 6.6 1.8 4.7 Total Cash From Operations $32.4 $33.5 $20.7 $34.7 $37.7 Cash From Investing: Capital Expenditures $7.3 $7.7 $6.2 $5.1 $8.2 Plus: Increases in Other Non-Current Assets 0.5 (0.2) (0.3) (1.7) Total Cash Used in Investing $7.8 $7.5 $5.9 $5.8 $6.5 Cash From Financing: Repayment of Debt $8.0 $8.8 $9.0 $8.0 $11.0 Plus: Dividend Payments 14.4 16.4 61 17.9 23.0 Cash Used in Financing $22.4 $25.2 $15.1 $25.9 $34.0 Total Cash Generated $2.2 $0.8 ($0.3) $3.0 ($2.8) HARVARD BUSINESS PUBLISHING | BRIEFCASES 7,011 6 SEP X 25 tv 20 DII DD A F10 FA E6 F8 F9 % & 3 5Case BA 7020.pdf Q Q 1 6 - 5 @ Q- Search Page 61 of 74 Exhibit 1: HPL's Historical Financial Statements Operating Results: 2003 2004 2005 2006 2007 Revenue $503.4 $543.7 $587.2 $636.1 $680.7 Less: Cost of Goods Sold 405.2 432.3 496.2 513.4 558.2 Gross Profit 98.2 111.4 91.0 122.7 122.5 Less: Selling, General & Administrative 37.8 44.6 45.8 51.5 49.0 EBITDA 60.4 66.8 45.2 71.2 73.5 Less: Depreciation 6.8 6.2 6.0 5.9 6.1 EBIT 53.6 60.6 39.2 65.3 67.4 Less: Interest Expense 5.5 5.8 5.9 5.3 3.3 EBT 48.1 54.8 33.3 60.0 64.1 Less: Taxes 19.2 22.0 13.3 24.0 25.6 Net Income $28.9 $32.8 $20.0 $36.0 $38.5 Margins Revenue Growth NA 8.0% 8.0% 8.3% 7.0% Gross Margin 19.5% 20.5% 15.5% 19.3% 18.0% Selling, General & Administrative/Revenue 7.5% 8.2% 7.8% 8.1% 7.2% EBITDA Margin 12.0% 12.3% 7.7% 11.2% 10.8% EBIT Margin 10.6% 11.1% 6.7% 10.3% 9.9% Net Income Margin 5.7% 6.0% 3.4% 5.7% 5.7% Effective Tax Rate 39.9% 40.1% 39.9% 40.0% 39.90 Assets: 2003 2004 2005 2006 2007 Cash & Cash Equivalents $4.3 $5.1 $4.8 $7.8 $5.0 Accounts Receivable 62.1 70.1 78.8 87.1 93.3 Inventory 57.7 58.0 61.2 61.9 67.3 Total Current Assets 124.1 135.2 144.8 156.8 165.6 Property, Plant & Equipment 201.4 202.9 203.1 202.3 204.4 Other Non-Current Assets 12.3 12.1 11.8 12.5 10.8 Total Assets $337.8 $348.2 359.7 $371.6 $380.8 Liabilities & Owners' Equity: Accounts Payable & Accrued Liabilities $42.2 $45.0 $51.6 $53.4 $58.1 Long-Term Debt 91.6 828 73.8 65.8 54.8 Owners' Equity 204.0 220.4 234.3 252.4 267.9 Total Liabilities & Owners' Equity $337.8 $348.2 $359.7 $371.6 $380.8 Net Working Capital: Accounts Receivable 62.1 70.1 78.8 87.1 93.3 Plus: Inventory 57.7 58.0 61.2 61.9 67.3 Less: Accounts Payable & Accrued Expenses 42.2 45.0 51.6 53.4 58.1 Net Working Capital 77.6 83.1 88.4 95.6 102.5 (Exhibit 1 cont'd next page) BRIEFCASES | HARVARD BUSINESS PUBLISHING 7,011 SEP 25 DII DD A 20 Q O F10 F6 F9 F3 F4 S % & 3 5 6Cone BA 7020.pdf The team that developed the proposal was led by Robert Gates, HPL's Executive Vice President of Manufacturing. They found the investment attractive because the additional capacity would allow HPL to expand its relationship with its largest customer (whose sales were growing in the U.S, and abroad) and generate an acceptable payback. The expansion would also create the opportunity to grow HPL's other customer relationships. Moreover, it might change the competitive landscape. Virtually all unit growth came from private label penetration gains that, although steady, were too modest to support significant expansions by multiple producers. Knowing this, HPL's competitors might be deterred from expanding their production capacity in HPL's personal care subsegments- especially since HPL's announcement would be supported by a multiyear contract with a powerful customer. However, the team acknowledged that the project presented risks unlike any that HPL had previously encountered. First, making this level of investment and incurring the associated debt would significantly increase HPL's annual fixed costs and its risk of financial distress should sales fall, costs rise, or both. Second, the sales that would support the capacity growth would come, at least initially, from what was already HPL's largest customer. Although HPL had a long and positive relationship with the customer, the demand could disappear at the end of the initial three-year contract Final Steps Toward a Decision The annual capital planning process took place during an all-day working session hosted by Tucker Hansson each October. In the meeting, Hansson and his staff, including the managers of each facility, reviewed the capital requests and the related scoring prepared by CFO Sheila Dowling. They agreed on a prioritization of the projects, discussed the trade-offs of choosing various projects over others, and inquired into the opportunities and consequences of pursuing listed projects at lower levels of expenditure. The capital budget for the next year was typically finalized at Harisson's first staff meeting each December when any unanswered questions from the October session were addressed and the team reviewed the final plan one last time, including consideration of the latest forecast for EBITDA and the resulting capital budget for the following year. For his part, Hansson usually relied heavily on Dowling's scoring to compare projects, but her typical approach to risk assessment was not helpful for this project. The size of the investment posed additional risk beyond what HPL typically contemplated. As a result, Hansson's questions about payback and risk had a more "macro" focus than usual; he wondered how much value the project would really generate. how much risk HPL should tolerate, how the company could mitigate the risks, and what the backup plans should be if unforeseen risks materialized. Making the wrong decision could have serious consequences stemming from increased capacity, fixed costs, and debt service. Moreover, Hansson knew that the cost of debt was likely to be pricy in terms of both interest expense and restrictive covenants, and that equity financing on favorable terms was extremely unlikely. Hansson also knew his team was unhappy that his uncertainty was delaying the process. Furthermore, he realized that after several years without a big investment, the team was beginning to wonder whether he was transitioning into "harvest mode" and, therefore, whether their days with HPL were numbered. Hansson had to overcome his apprehensions and make a decision Pursuing this investment in capacity would close off all other investment opportunities for the foreseeable future. The company's financial position would be at the limit of Hansson's comfort zone, and HPL's managerial bench would be tapped out. He found the singular focus invigorating; indeed, 25 City a
Step by Step Solution
There are 3 Steps involved in it
1 Expert Approved Answer
Step: 1 Unlock
Question Has Been Solved by an Expert!
Get step-by-step solutions from verified subject matter experts
Step: 2 Unlock
Step: 3 Unlock
Students Have Also Explored These Related Accounting Questions!