

Question: Please review the case study titled Hansson Private Label found in your course pack. You should submit two documents: an excel spreadsheet with your future
Please review the case study titled "Hansson Private Label" found in your course pack. You should submit two documents: an excel spreadsheet with your future cash flows and calculations and a one page word document describing your assumptions, findings, and interpretation of what your findings mean to the company. The key to the case is utilizing data to predict future cash flows, determining what discount factor to use, and perform NPV analysis. 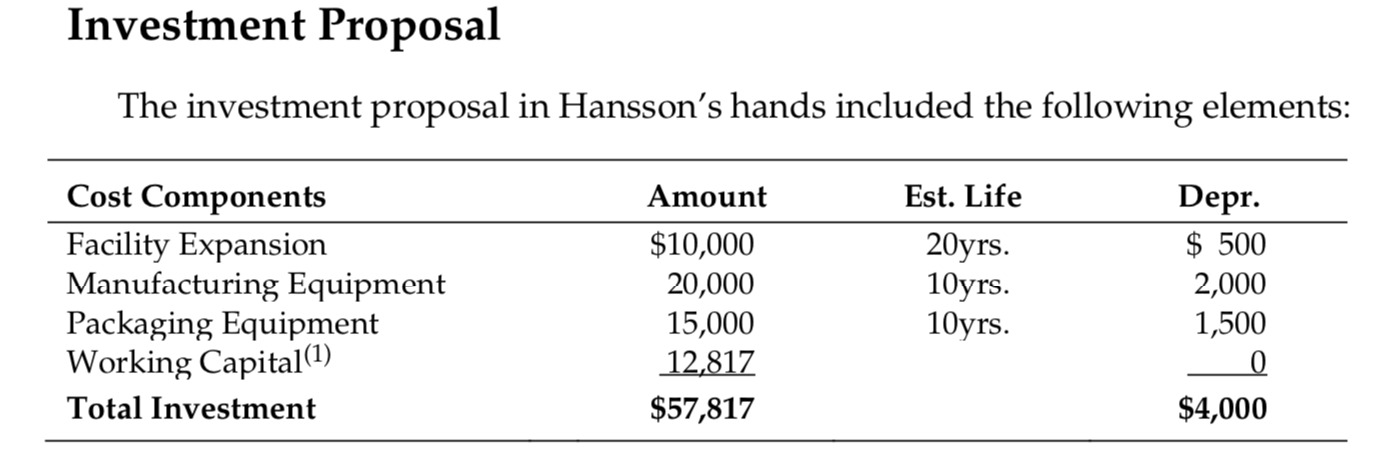
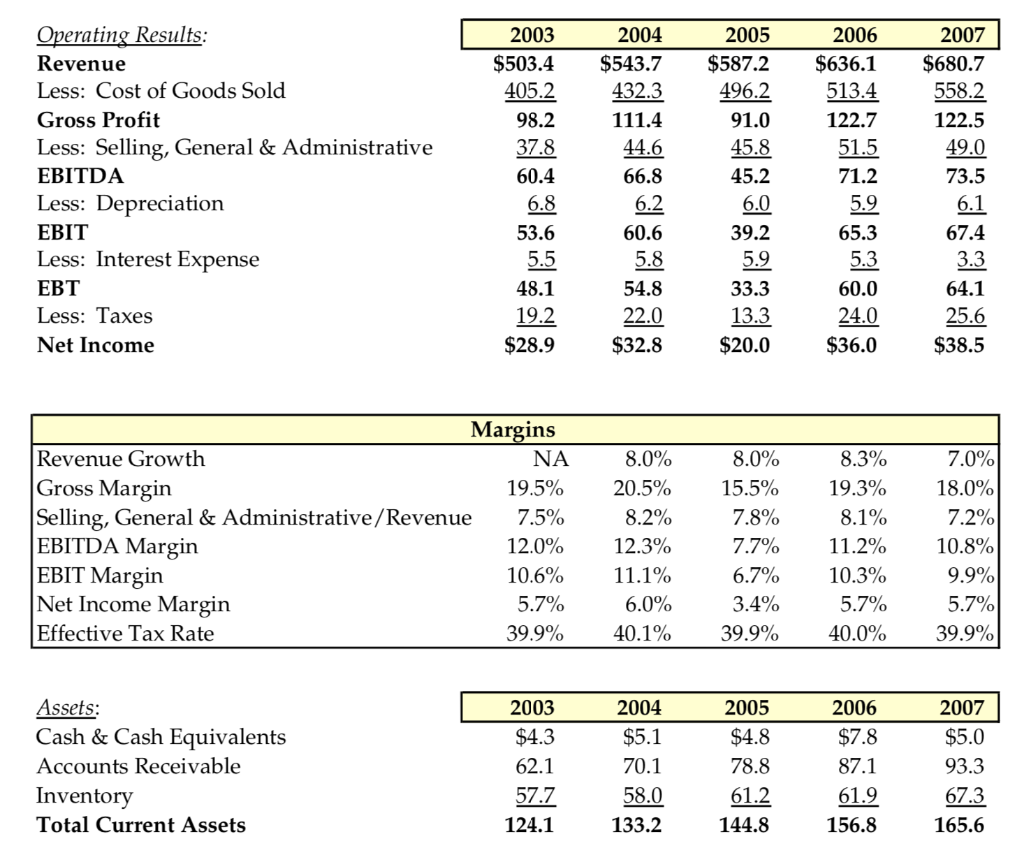
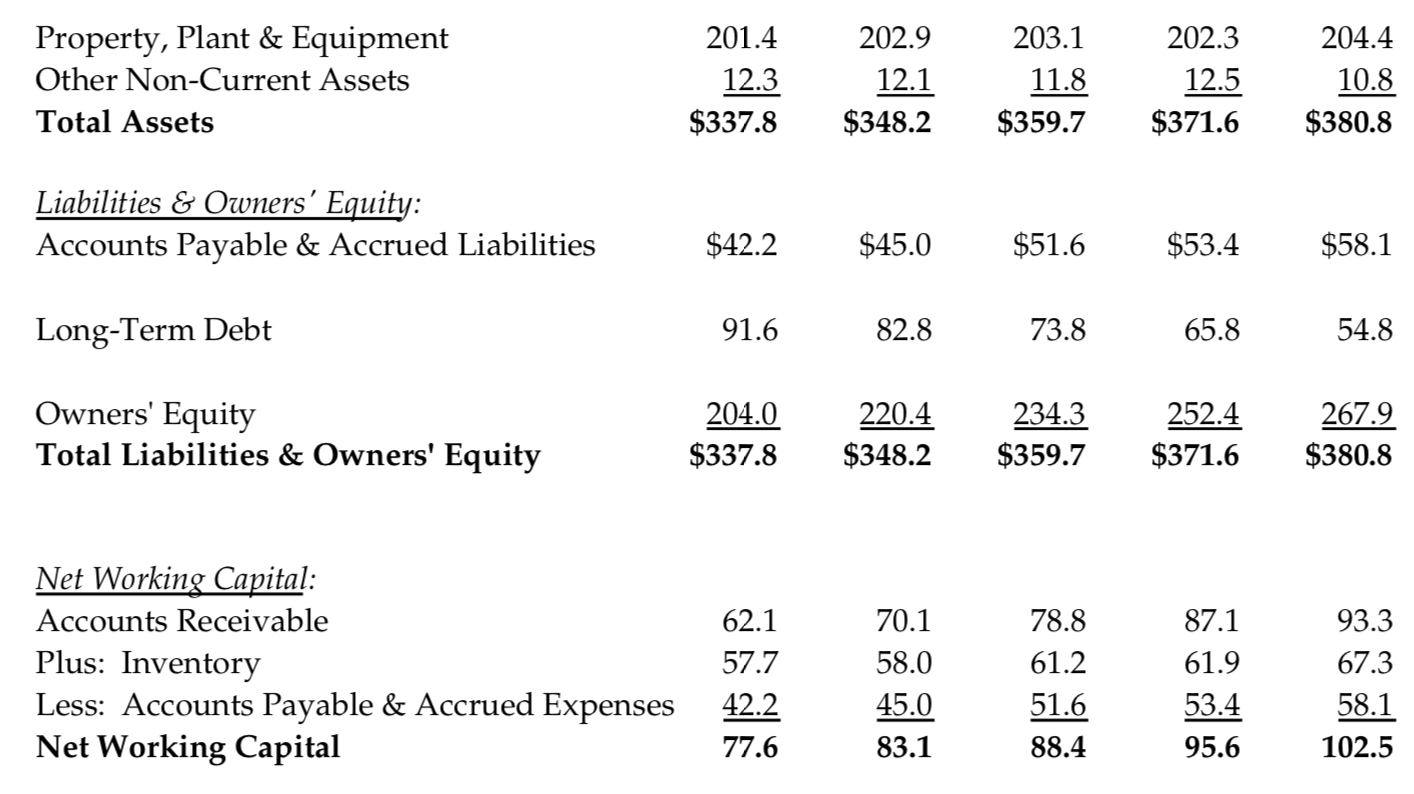
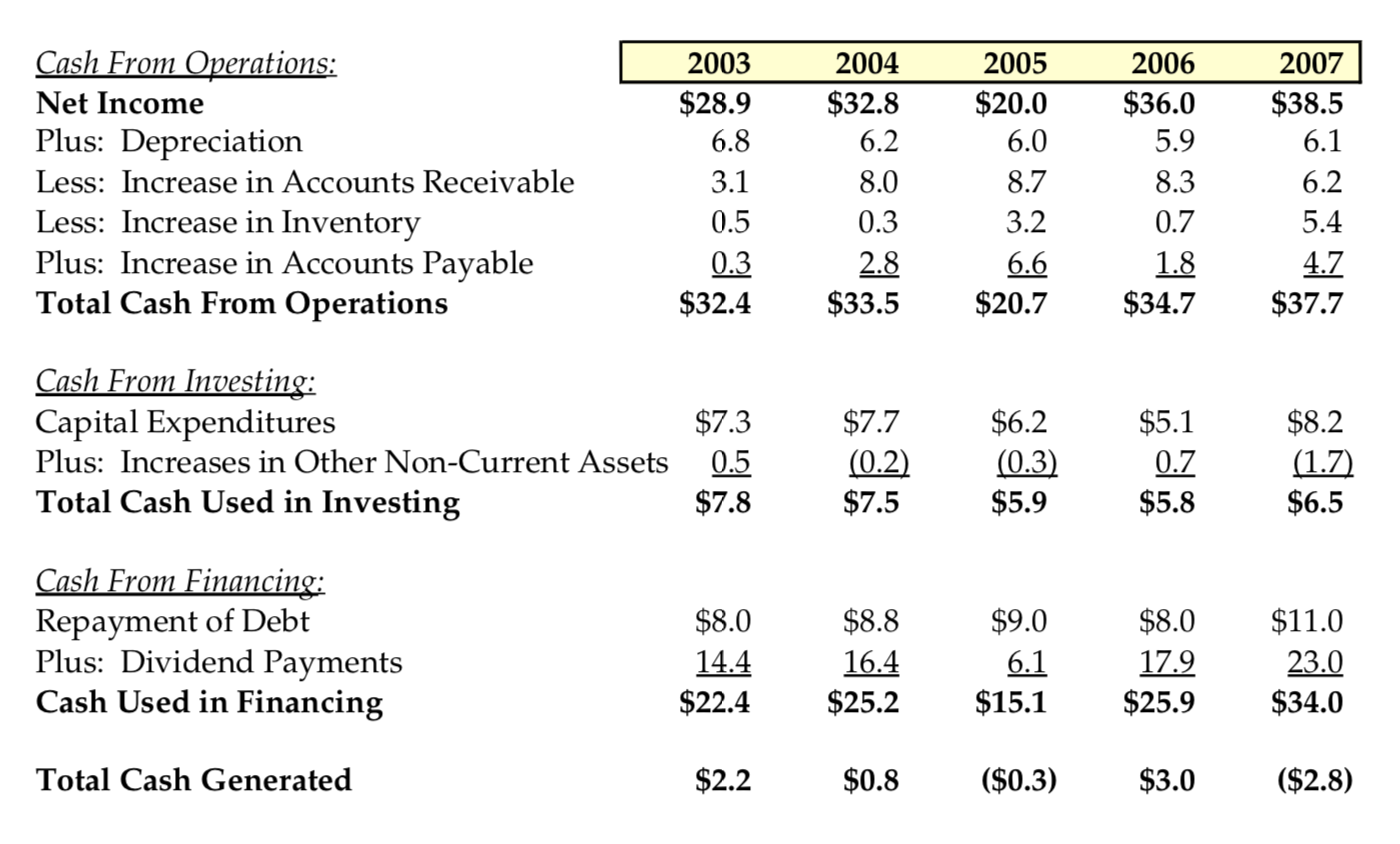
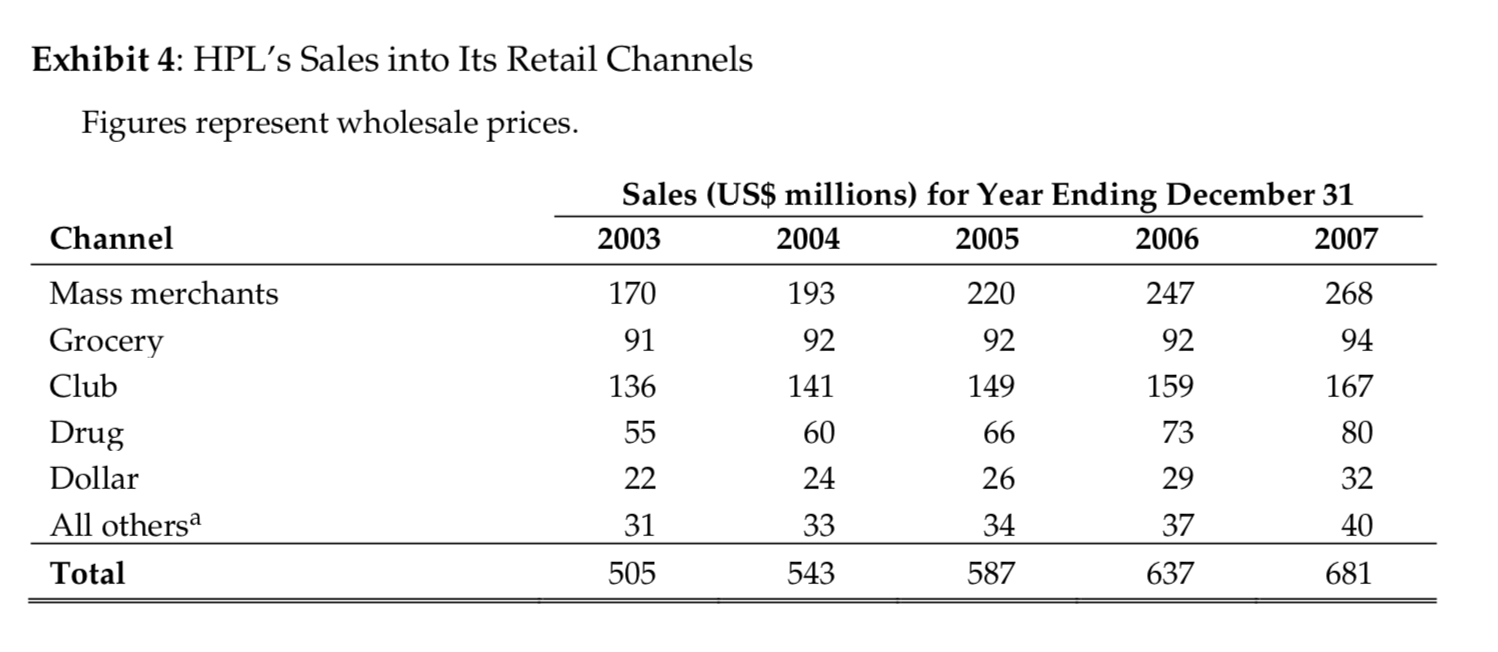
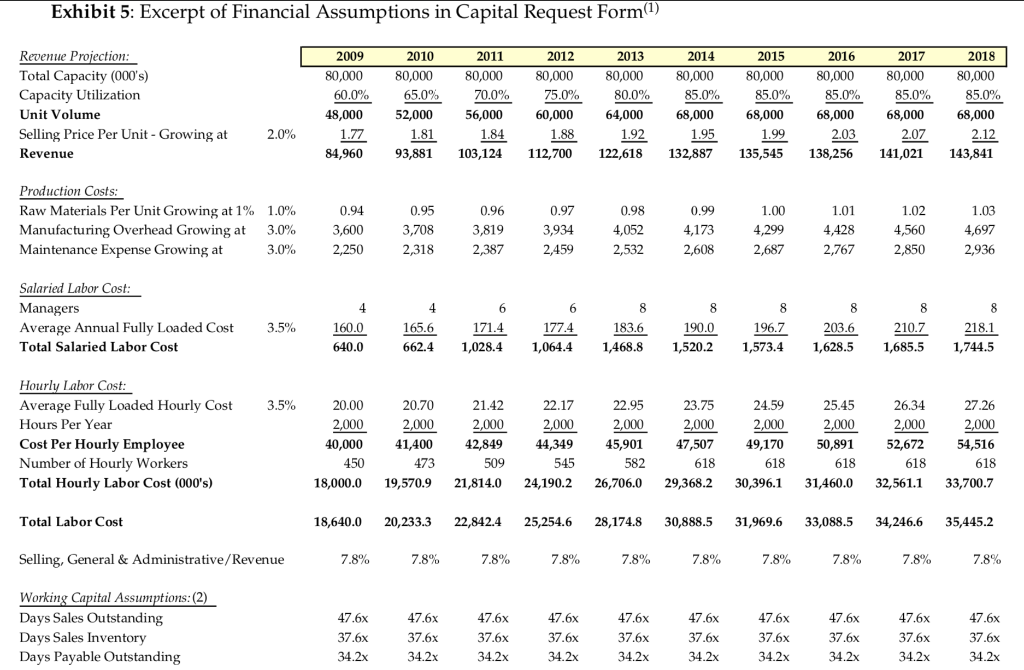
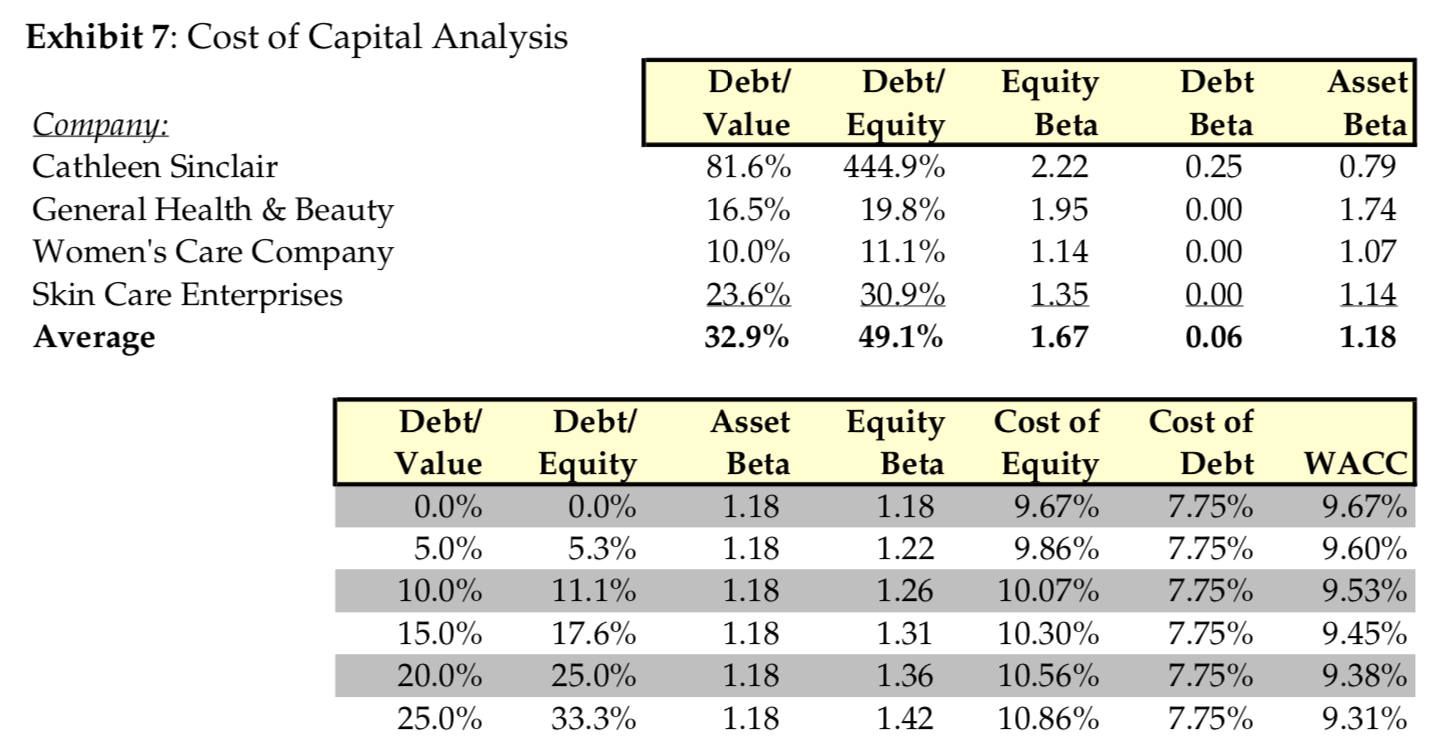
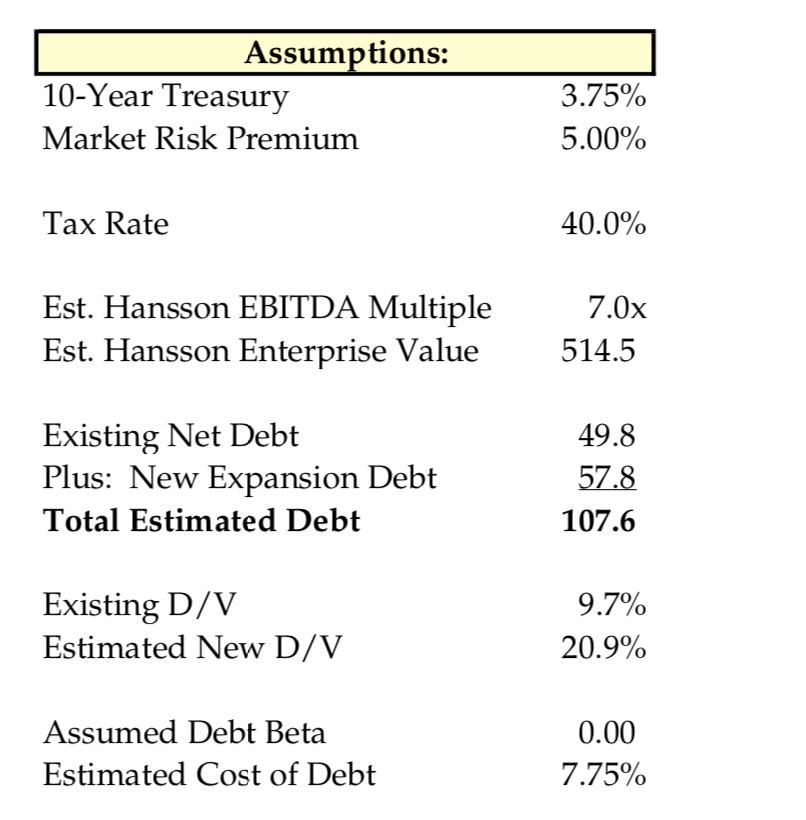
Investment Proposal The investment proposal in Hansson's hands included the following elements: Cost Components Facility Expansion Manufacturing Equipment Packaging Equipment Working Capital(1) Total Investment Amount $10,000 20,000 15,000 12,817 $57,817 Est. Life 20yrs. 10yrs. 10yrs. Depr. $ 500 2,000 1,500 0 $4,000 Operating Results: Revenue Less: Cost of Goods Sold Gross Profit Less: Selling, General & Administrative EBITDA Less: Depreciation EBIT Less: Interest Expense EBT Less: Taxes Net Income 2003 $503.4 405.2 98.2 37.8 60.4 6.8 53.6 5.5 2004 $543.7 432.3 111.4 44.6 66.8 6.2 60.6 5.8 54.8 22.0 $32.8 2005 $587.2 496.2 91.0 45.8 45.2 6.0 39.2 5.9 33.3 13.3 $20.0 2006 $636.1 513.4 122.7 51.5 71.2 5.9 65.3 5.3 60.0 24.0 $36.0 2007 $680.7 558.2 122.5 49.0 73.5 6.1 67.4 3.3 64.1 25.6 $38.5 48.1 19.2 $28.9 Margins Revenue Growth NA Gross Margin 19.5% Selling, General & Administrative/Revenue 7.5% EBITDA Margin 12.0% EBIT Margin 10.6% Net Income Margin 5.7% Effective Tax Rate 39.9% 8.0% 20.5% 8.2% 12.3% 11.1% 6.0% 40.1% 8.0% 15.5% 7.8% 7.7% 6.7% 3.4% 39.9% 8.3% 19.3% 8.1% 11.2% 10.3% 5.7% 40.0% 7.0% 18.0% 7.2% 10.8% 9.9% 5.7% 39.9% Assets: Cash & Cash Equivalents Accounts Receivable Inventory Total Current Assets 2003 $4.3 62.1 57.7 124.1 2004 $5.1 70.1 58.0 133.2 2005 $4.8 78.8 61.2 144.8 2006 $7.8 87.1 61.9 156.8 2007 $5.0 93.3 67.3 165.6 Property, Plant & Equipment Other Non-Current Assets Total Assets 201.4 12.3 $337.8 202.9 12.1 $348.2 203.1 11.8 $359.7 202.3 12.5 $371.6 204.4 10.8 $380.8 Liabilities & Owners' Equity: Accounts Payable & Accrued Liabilities $42.2 $45.0 $51.6 $53.4 $58.1 Long-Term Debt 91.6 82.8 73.8 65.8 54.8 Owners' Equity Total Liabilities & Owners' Equity 204.0 $337.8 220.4 $348.2 234.3 $359.7 252.4 $371.6 267.9 $380.8 Net Working Capital: Accounts Receivable Plus: Inventory Less: Accounts Payable & Accrued Expenses Net Working Capital 62.1 57.7 42.2 77.6 70.1 58.0 45.0 83.1 78.8 61.2 51.6 88.4 87.1 61.9 53.4 95.6 93.3 67.3 58.1 102.5 Cash From Operations: Net Income Plus: Depreciation Less: Increase in Accounts Receivable Less: Increase in Inventory Plus: Increase in Accounts Payable Total Cash From Operations 2003 $28.9 6.8 3.1 0.5 0.3 $32.4 2004 $32.8 6.2 8.0 0.3 2.8 $33.5 2005 $20.0 6.0 8.7 3.2 6.6 $20.7 2006 $36.0 5.9 8.3 0.7 1.8 $34.7 2007 $38.5 6.1 6.2 5.4 4.7 $37.7 Cash From Investing: Capital Expenditures Plus: Increases in Other Non-Current Assets Total Cash Used in Investing $7.3 0.5 $7.8 $7.7 (0.2) $7.5 $6.2 (0.3) $5.9 $5.1 0.7 $5.8 $8.2 (1.7) $6.5 $8.8 Cash From Financing: Repayment of Debt Plus: Dividend Payments Cash Used in Financing $8.0 14.4 $22.4 16.4 $9.0 6.1 $15.1 $8.0 17.9 $25.9 $11.0 23.0 $34.0 $25.2 Total Cash Generated $2.2 $0.8 ($0.3) $3.0 ($2.8) Exhibit 4: HPL's Sales into Its Retail Channels Figures represent wholesale prices. Sales (US$ millions) for Year Ending December 31 2003 2004 2005 2006 2007 Channel 220 Mass merchants Grocery Club Drug Dollar All othersa Total 170 91 136 55 22 193 92 141 60 24 33 543 92 149 66 247 92 159 73 29 268 94 167 80 32 40 26 31 34 37 505 587 637 681 Exhibit 5: Excerpt of Financial Assumptions in Capital Request Form(1) 2010 2018 Revenue Projection: Total Capacity (000's) Capacity Utilization Unit Volume Selling Price Per Unit - Growing at Revenue 2009 80,000 60.0% 48,000 1.77 84,960 80,000 65.0% 52,000 1.81 93,881 2011 80,000 70.0% 56,000 1.84 103,124 2012 80,000 75.0% 60,000 1.88 112,700 2013 80,000 80.0% 64,000 1.92 122,618 2014 80,000 85.0% 68,000 1.95 132,887 2015 80,000 85.0% 68,000 1.99 135,545 2016 80,000 85.0% 68,000 2.03 138,256 2017 80,000 85.0% 68,000 2.07 141,021 80,000 85.0% 68,000 2.12 143,841 2.0% Production Costs: Raw Materials Per Unit Growing at 1% 1.0% Manufacturing Overhead Growing at 3.0% Maintenance Expense Growing at 3.0% 0.94 3,600 2,250 0.95 3,708 2,318 0.96 3,819 2,387 0.97 3,934 0.98 4,052 2,532 0.99 4,173 2,608 1.00 4,299 1.01 4,428 2,767 1.02 4,560 2,850 1.03 4,697 2,936 2,459 2,687 8 8 Salaried Labor Cost: Managers Average Annual Fully Loaded Cost Total Salaried Labor Cost 3.5% 4 160.0 640.0 4 165.6 662.4 6 171.4 1,028.4 177.4 1,064.4 8 8 183.6 1,468.8 190.0 1,520.2 8 196.7 1,573.4 8 203.6 1,628.5 8 8 210.7 1,685.5 218.1 1,744.5 3.5% Hourly Labor Cost: Average Fully Loaded Hourly Cost Hours Per Year Cost Per Hourly Employee Number of Hourly Workers Total Hourly Labor Cost (000's) 20.00 2,000 40,000 450 18,000.0 20.70 2,000 41,400 473 19,570.9 21.42 2,000 42,849 509 21,814.0 22.17 2,000 44,349 545 24,190.2 22.95 2,000 45,901 582 26,706.0 23.75 2,000 47,507 618 29,368.2 24.59 2,000 49,170 618 30,396.1 25.45 2,000 50,891 618 31,460.0 26.34 2,000 52,672 618 32,561.1 27.26 2,000 54,516 618 33,700.7 Total Labor Cost 18,640.0 20,233.3 22,842.4 25,254.6 28,174.8 30,888.5 31,969.6 33,088.5 34,246.6 35,445.2 Selling, General & Administrative/Revenue 7.8% 7.8% 7.8% 7.8% 7.8% 7.8% 7.8% 7.8% 7.8% 7.8% Working Capital Assumptions:(2) Days Sales Outstanding Days Sales Inventory Days Payable Outstanding 47.6x 37.6x 34. 2x 47.6x 37.6x 34.2x 47.6x 37.6x 34.2x 47.6x 37.6x 34.2x 47.6x 37.6x 34.2x 47.6x 37.6x 34.2x 47.6x 37.6x 34.2x 47.6x 37.6x 34.2x 47.6x 37.6x 34.2x 47.6x 37.6x 34.2x Exhibit 7: Cost of Capital Analysis Company: Cathleen Sinclair General Health & Beauty Women's Care Company Skin Care Enterprises Average Debt/ Value 81.6% 16.5% 10.0% 23.6% 32.9% Debt/ Equity 444.9% 19.8% 11.1% 30.9% 49.1% Equity Beta 2.22 1.95 1.14 1.35 1.67 Debt Beta 0.25 0.00 0.00 0.00 0.06 Asset Beta 0.79 1.74 1.07 1.14 1.18 Debt/ Value 0.0% 5.0% 10.0% 15.0% 20.0% 25.0% Debt/ Equity 0.0% 5.3% 11.1% 17.6% 25.0% 33.3% Asset Beta 1.18 1.18 1.18 1.18 1.18 1.18 Equity Beta 1.18 1.22 1.26 1.31 1.36 1.42 Cost of Equity 9.67% 9.86% 10.07% 10.30% 10.56% 10.86% Cost of Debt 7.75% 7.75% 7.75% 7.75% 7.75% 7.75% WACC 9.67% 9.60% 9.53% 9.45% 9.38% 9.31% Assumptions: 10-Year Treasury Market Risk Premium 3.75% 5.00% Tax Rate 40.0% Est. Hansson EBITDA Multiple Est. Hansson Enterprise Value 7.0x 514.5 Existing Net Debt Plus: New Expansion Debt Total Estimated Debt 49.8 57.8 107.6 Existing D/V Estimated New D/V 9.7% 20.9% Assumed Debt Beta Estimated Cost of Debt 0.00 7.75% Investment Proposal The investment proposal in Hansson's hands included the following elements: Cost Components Facility Expansion Manufacturing Equipment Packaging Equipment Working Capital(1) Total Investment Amount $10,000 20,000 15,000 12,817 $57,817 Est. Life 20yrs. 10yrs. 10yrs. Depr. $ 500 2,000 1,500 0 $4,000 Operating Results: Revenue Less: Cost of Goods Sold Gross Profit Less: Selling, General & Administrative EBITDA Less: Depreciation EBIT Less: Interest Expense EBT Less: Taxes Net Income 2003 $503.4 405.2 98.2 37.8 60.4 6.8 53.6 5.5 2004 $543.7 432.3 111.4 44.6 66.8 6.2 60.6 5.8 54.8 22.0 $32.8 2005 $587.2 496.2 91.0 45.8 45.2 6.0 39.2 5.9 33.3 13.3 $20.0 2006 $636.1 513.4 122.7 51.5 71.2 5.9 65.3 5.3 60.0 24.0 $36.0 2007 $680.7 558.2 122.5 49.0 73.5 6.1 67.4 3.3 64.1 25.6 $38.5 48.1 19.2 $28.9 Margins Revenue Growth NA Gross Margin 19.5% Selling, General & Administrative/Revenue 7.5% EBITDA Margin 12.0% EBIT Margin 10.6% Net Income Margin 5.7% Effective Tax Rate 39.9% 8.0% 20.5% 8.2% 12.3% 11.1% 6.0% 40.1% 8.0% 15.5% 7.8% 7.7% 6.7% 3.4% 39.9% 8.3% 19.3% 8.1% 11.2% 10.3% 5.7% 40.0% 7.0% 18.0% 7.2% 10.8% 9.9% 5.7% 39.9% Assets: Cash & Cash Equivalents Accounts Receivable Inventory Total Current Assets 2003 $4.3 62.1 57.7 124.1 2004 $5.1 70.1 58.0 133.2 2005 $4.8 78.8 61.2 144.8 2006 $7.8 87.1 61.9 156.8 2007 $5.0 93.3 67.3 165.6 Property, Plant & Equipment Other Non-Current Assets Total Assets 201.4 12.3 $337.8 202.9 12.1 $348.2 203.1 11.8 $359.7 202.3 12.5 $371.6 204.4 10.8 $380.8 Liabilities & Owners' Equity: Accounts Payable & Accrued Liabilities $42.2 $45.0 $51.6 $53.4 $58.1 Long-Term Debt 91.6 82.8 73.8 65.8 54.8 Owners' Equity Total Liabilities & Owners' Equity 204.0 $337.8 220.4 $348.2 234.3 $359.7 252.4 $371.6 267.9 $380.8 Net Working Capital: Accounts Receivable Plus: Inventory Less: Accounts Payable & Accrued Expenses Net Working Capital 62.1 57.7 42.2 77.6 70.1 58.0 45.0 83.1 78.8 61.2 51.6 88.4 87.1 61.9 53.4 95.6 93.3 67.3 58.1 102.5 Cash From Operations: Net Income Plus: Depreciation Less: Increase in Accounts Receivable Less: Increase in Inventory Plus: Increase in Accounts Payable Total Cash From Operations 2003 $28.9 6.8 3.1 0.5 0.3 $32.4 2004 $32.8 6.2 8.0 0.3 2.8 $33.5 2005 $20.0 6.0 8.7 3.2 6.6 $20.7 2006 $36.0 5.9 8.3 0.7 1.8 $34.7 2007 $38.5 6.1 6.2 5.4 4.7 $37.7 Cash From Investing: Capital Expenditures Plus: Increases in Other Non-Current Assets Total Cash Used in Investing $7.3 0.5 $7.8 $7.7 (0.2) $7.5 $6.2 (0.3) $5.9 $5.1 0.7 $5.8 $8.2 (1.7) $6.5 $8.8 Cash From Financing: Repayment of Debt Plus: Dividend Payments Cash Used in Financing $8.0 14.4 $22.4 16.4 $9.0 6.1 $15.1 $8.0 17.9 $25.9 $11.0 23.0 $34.0 $25.2 Total Cash Generated $2.2 $0.8 ($0.3) $3.0 ($2.8) Exhibit 4: HPL's Sales into Its Retail Channels Figures represent wholesale prices. Sales (US$ millions) for Year Ending December 31 2003 2004 2005 2006 2007 Channel 220 Mass merchants Grocery Club Drug Dollar All othersa Total 170 91 136 55 22 193 92 141 60 24 33 543 92 149 66 247 92 159 73 29 268 94 167 80 32 40 26 31 34 37 505 587 637 681 Exhibit 5: Excerpt of Financial Assumptions in Capital Request Form(1) 2010 2018 Revenue Projection: Total Capacity (000's) Capacity Utilization Unit Volume Selling Price Per Unit - Growing at Revenue 2009 80,000 60.0% 48,000 1.77 84,960 80,000 65.0% 52,000 1.81 93,881 2011 80,000 70.0% 56,000 1.84 103,124 2012 80,000 75.0% 60,000 1.88 112,700 2013 80,000 80.0% 64,000 1.92 122,618 2014 80,000 85.0% 68,000 1.95 132,887 2015 80,000 85.0% 68,000 1.99 135,545 2016 80,000 85.0% 68,000 2.03 138,256 2017 80,000 85.0% 68,000 2.07 141,021 80,000 85.0% 68,000 2.12 143,841 2.0% Production Costs: Raw Materials Per Unit Growing at 1% 1.0% Manufacturing Overhead Growing at 3.0% Maintenance Expense Growing at 3.0% 0.94 3,600 2,250 0.95 3,708 2,318 0.96 3,819 2,387 0.97 3,934 0.98 4,052 2,532 0.99 4,173 2,608 1.00 4,299 1.01 4,428 2,767 1.02 4,560 2,850 1.03 4,697 2,936 2,459 2,687 8 8 Salaried Labor Cost: Managers Average Annual Fully Loaded Cost Total Salaried Labor Cost 3.5% 4 160.0 640.0 4 165.6 662.4 6 171.4 1,028.4 177.4 1,064.4 8 8 183.6 1,468.8 190.0 1,520.2 8 196.7 1,573.4 8 203.6 1,628.5 8 8 210.7 1,685.5 218.1 1,744.5 3.5% Hourly Labor Cost: Average Fully Loaded Hourly Cost Hours Per Year Cost Per Hourly Employee Number of Hourly Workers Total Hourly Labor Cost (000's) 20.00 2,000 40,000 450 18,000.0 20.70 2,000 41,400 473 19,570.9 21.42 2,000 42,849 509 21,814.0 22.17 2,000 44,349 545 24,190.2 22.95 2,000 45,901 582 26,706.0 23.75 2,000 47,507 618 29,368.2 24.59 2,000 49,170 618 30,396.1 25.45 2,000 50,891 618 31,460.0 26.34 2,000 52,672 618 32,561.1 27.26 2,000 54,516 618 33,700.7 Total Labor Cost 18,640.0 20,233.3 22,842.4 25,254.6 28,174.8 30,888.5 31,969.6 33,088.5 34,246.6 35,445.2 Selling, General & Administrative/Revenue 7.8% 7.8% 7.8% 7.8% 7.8% 7.8% 7.8% 7.8% 7.8% 7.8% Working Capital Assumptions:(2) Days Sales Outstanding Days Sales Inventory Days Payable Outstanding 47.6x 37.6x 34. 2x 47.6x 37.6x 34.2x 47.6x 37.6x 34.2x 47.6x 37.6x 34.2x 47.6x 37.6x 34.2x 47.6x 37.6x 34.2x 47.6x 37.6x 34.2x 47.6x 37.6x 34.2x 47.6x 37.6x 34.2x 47.6x 37.6x 34.2x Exhibit 7: Cost of Capital Analysis Company: Cathleen Sinclair General Health & Beauty Women's Care Company Skin Care Enterprises Average Debt/ Value 81.6% 16.5% 10.0% 23.6% 32.9% Debt/ Equity 444.9% 19.8% 11.1% 30.9% 49.1% Equity Beta 2.22 1.95 1.14 1.35 1.67 Debt Beta 0.25 0.00 0.00 0.00 0.06 Asset Beta 0.79 1.74 1.07 1.14 1.18 Debt/ Value 0.0% 5.0% 10.0% 15.0% 20.0% 25.0% Debt/ Equity 0.0% 5.3% 11.1% 17.6% 25.0% 33.3% Asset Beta 1.18 1.18 1.18 1.18 1.18 1.18 Equity Beta 1.18 1.22 1.26 1.31 1.36 1.42 Cost of Equity 9.67% 9.86% 10.07% 10.30% 10.56% 10.86% Cost of Debt 7.75% 7.75% 7.75% 7.75% 7.75% 7.75% WACC 9.67% 9.60% 9.53% 9.45% 9.38% 9.31% Assumptions: 10-Year Treasury Market Risk Premium 3.75% 5.00% Tax Rate 40.0% Est. Hansson EBITDA Multiple Est. Hansson Enterprise Value 7.0x 514.5 Existing Net Debt Plus: New Expansion Debt Total Estimated Debt 49.8 57.8 107.6 Existing D/V Estimated New D/V 9.7% 20.9% Assumed Debt Beta Estimated Cost of Debt 0.00 7.75%
Step by Step Solution
There are 3 Steps involved in it

Get step-by-step solutions from verified subject matter experts