

Question: An Excel worksheet is provided that shows the required time for each product (SKU) on each resource (machine), as well as demand and margin/unit for
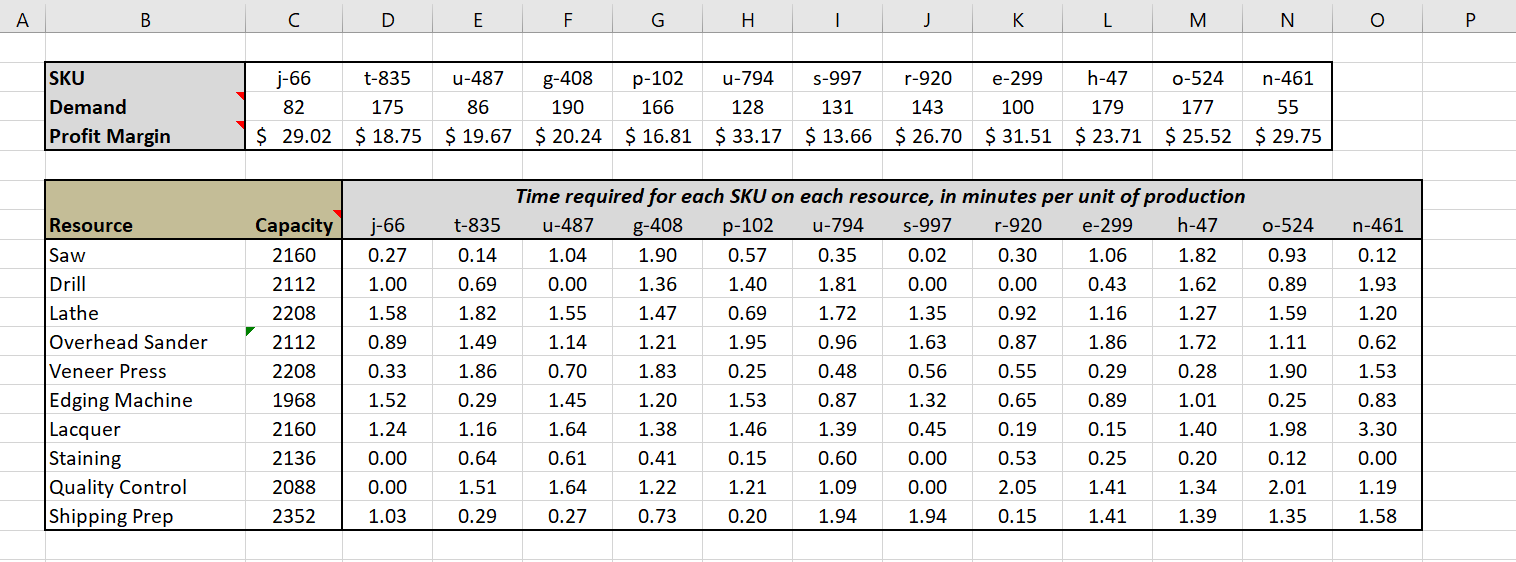
An Excel worksheet is provided that shows the required time for each product (SKU) on each "resource" (machine), as well as demand and margin/unit for each product (SKU). Determine the system constraint (i.e., the resource that has demand, in terms of aggregate workload, that is greater than the capacity for that resource.)
This is the entire question
A B D E F G . I J K L M N O P t-835 U-487 u-794 e-299 h-47 SKU Demand Profit Margin j-66 82 $ 29.02 175 86 $ 18.75 $ 19.67 8-408 190 $ 20.24 p-102 166 $ 16.81 128 $ 33.17 s-997 131 $ 13.66 r-920 143 $ 26.70 100 $ 31.51 179 $ 23.71 0-524 n-461 177 55 $ 25.52 $29.75 t-835 n-461 0-524 0.93 0.14 j-66 0.27 1.00 1.58 0.89 0.12 1.93 0.89 0.69 1.82 1.49 1.59 1.11 Resource Saw Drill Lathe Overhead Sander Veneer Press Edging Machine Lacquer Staining Quality Control Shipping Prep Capacity 2160 2112 2208 2112 2208 1968 2160 2136 2088 2352 Time required for each SKU on each resource, in minutes per unit of production u-487 g-408 p-102 u-794 S-997 r-920 e-299 h-47 1.04 1.90 0.57 0.35 0.02 0.30 1.06 1.82 0.00 1.36 1.40 1.81 0.00 0.00 0.43 1.62 1.55 1.47 0.69 1.72 1.35 0.92 1.16 1.27 1.14 1.21 1.95 0.96 1.63 0.87 1.86 1.72 0.70 1.83 0.25 0.48 0.56 0.55 0.29 0.28 1.45 1.20 1.53 0.87 1.32 0.65 0.89 1.01 1.64 1.38 1.46 1.39 0.45 0.19 0.15 1.40 0.61 0.41 0.15 0.60 0.00 0.53 0.25 0.20 1.64 1.22 1.21 1.09 0.00 2.05 1.41 1.34 0.27 0.73 0.20 1.94 1.94 0.15 1.41 1.39 0.33 1.52 1.24 0.00 0.00 1.03 1.86 0.29 1.16 0.64 1.51 0.29 1.90 0.25 1.98 0.12 2.01 1.35 1.20 0.62 1.53 0.83 3.30 0.00 1.19 1.58Step by Step Solution
There are 3 Steps involved in it
1 Expert Approved Answer
Step: 1 Unlock

Question Has Been Solved by an Expert!
Get step-by-step solutions from verified subject matter experts
Step: 2 Unlock
Step: 3 Unlock