

Question: An Excel worksheet is provided that shows the required time for each product (SKU) on each resource (machine), as well as demand and margin/unit for
-
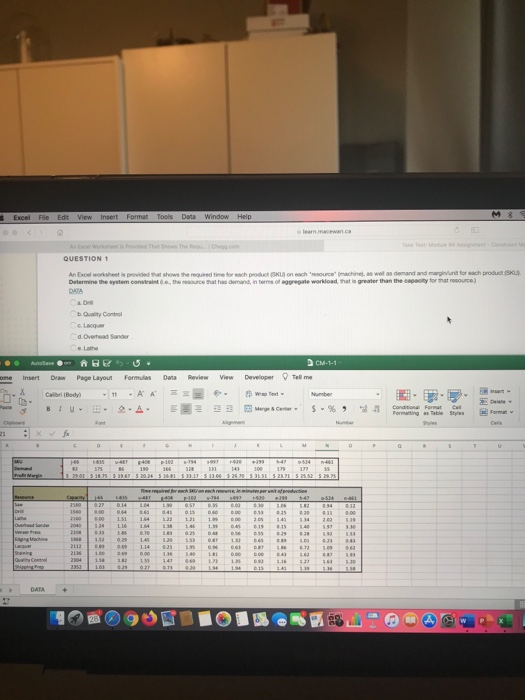
An Excel worksheet is provided that shows the required time for each product (SKU) on each "resource" (machine), as well as demand and margin/unit for each product (SKU). Determine the system constraint (i.e., the resource that has demand, in terms of aggregate workload, that is greater than the capacity for that resource.) DATA link.
a. Drill
b. Quality Control
c. Lacquer
d. Overhead Sander
e. Lathe
| SKU | j-66 | t-835 | u-487 | g-408 | p-102 | u-794 | s-997 | r-920 | e-299 | h-47 | o-524 | n-461 | ||
| Demand | 82 | 175 | 86 | 190 | 166 | 128 | 131 | 143 | 100 | 179 | 177 | 55 | ||
| Profit Margin | $ 29.02 | $ 18.75 | $ 19.67 | $ 20.24 | $ 16.81 | $ 33.17 | $ 13.66 | $ 26.70 | $ 31.51 | $ 23.71 | $ 25.52 | $ 29.75 | ||
| Time required for each SKU on each resource, in minutes per unit of production | ||||||||||||||
| Resource | Capacity | j-66 | t-835 | u-487 | g-408 | p-102 | u-794 | s-997 | r-920 | e-299 | h-47 | o-524 | n-461 | |
| Saw | 2160 | 0.27 | 0.14 | 1.04 | 1.90 | 0.57 | 0.35 | 0.02 | 0.30 | 1.06 | 1.82 | 0.94 | 0.12 | |
| Drill | 1560 | 0.00 | 0.64 | 0.61 | 0.41 | 0.15 | 0.60 | 0.00 | 0.53 | 0.25 | 0.20 | 0.11 | 0.00 | |
| Lathe | 2160 | 0.00 | 1.51 | 1.64 | 1.22 | 1.21 | 1.99 | 0.00 | 2.05 | 1.41 | 1.34 | 2.02 | 1.19 | |
| Overhead Sander | 2040 | 1.24 | 1.16 | 1.64 | 1.38 | 1.46 | 1.39 | 0.45 | 0.19 | 0.15 | 1.40 | 1.97 | 3.30 | |
| Veneer Press | 2208 | 0.33 | 1.86 | 0.70 | 1.83 | 0.25 | 0.48 | 0.56 | 0.55 | 0.29 | 0.28 | 1.92 | 1.53 | |
| Edging Machine | 1968 | 1.52 | 0.29 | 1.45 | 1.20 | 1.53 | 0.87 | 1.32 | 0.65 | 0.89 | 1.01 | 0.23 | 0.83 | |
| Lacquer | 2112 | 0.89 | 0.69 | 1.14 | 0.21 | 1.95 | 0.96 | 0.63 | 0.87 | 1.86 | 0.72 | 1.09 | 0.62 | |
| Staining | 2136 | 1.00 | 0.69 | 0.00 | 1.36 | 1.40 | 1.81 | 0.00 | 0.00 | 0.43 | 1.62 | 0.87 | 1.93 | |
| Quality Control | 2304 | 1.58 | 1.82 | 1.55 | 1.47 | 0.69 | 1.72 | 1.35 | 0.92 | 1.16 | 1.27 | 1.63 | 1.20 | |
| Shipping Prep | 2352 | 1.03 | 0.29 | 0.27 | 0.73 | 0.20 | 1.94 | 1.94 | 0.15 | 1.41 | 1.39 | 1.36 | 1.58 | |
Step by Step Solution
There are 3 Steps involved in it
1 Expert Approved Answer
Step: 1 Unlock

Question Has Been Solved by an Expert!
Get step-by-step solutions from verified subject matter experts
Step: 2 Unlock
Step: 3 Unlock