

Question: An experienced budget analyst at Marwin ,Inc,. , has been charged with assessing the firms financial performance during 2006 and its financial position at year-end
An experienced budget analyst at Marwin ,Inc,. , has been charged with assessing the firms financial performance during 2006 and its financial position at year-end 2006. To complete this assignment, she gathered the firms 2006 financial statements (below). In addition,
She obtained the firms ratio values for 2004 and 2005, along with the 2006 industry average ratios (also applicable to 2004 and 2005).
- LG1
TO DO
Q1. Calculate the firms 2006 financial ratios, and then fill in the preceding table. (Assume a 365-day year.) (13 marks ) (1 mark each ratio listed above )
Q2. Analyze the firms current financial position from both a cross-sectional and a time-series viewpoint. Break your analysis into evaluations of the firms liquidity, activity, debt, profitability, and market. (10 marks) ( 2 marks each categories )
Q3. Summarize the firms overall financial position on the basis of your findings in part b ( 4 marks )
Q4. What ethical issues could confront a financial manger? ( 3 marks )
|
Merill Incorporation |
|
| Historical and Industry Average Ratios | |
| Summary of Company Ratios (20042005, Including 2006 Industry Averages) | ||||
|
| 2004 | 2005 | 2006 | INDUSTRY AVERAGE RATIO |
| Overall Liquidity Current ratio | 2.04 | 2.08 |
| 2.05 |
| Quick (acid-test) ratio | 1.32 | 1.46 |
| 1.43 |
| Activity Inventory turnover | 5.7 | 5.7 |
| 6.6 |
| Average collection period | 43.8DAYS | 51.2DAYS |
| 44.3 days |
| Average payment period | 75.8 days | 81.2 days |
| 66.5 days |
| Total asset turnover | 0.94 | 0.79 |
| 0.75 |
| Debt Debt ratio | 36.80% | 44.30% |
| 40.00% |
| Times interest earned ratio | 5.6 | 3.3 |
| 4.3 |
| Fixed-payment coverage ratio | 2.4 | 1.4 |
| 1.5 |
| Gross profit margin | 31.40% | 33.30% |
| 30.00% |
| Operating profit margin | 14.60% | 11.80% |
| 11.00% |
| Net profit margin | 8.20% | 5.40% |
| 6.20% |
| Earnings per share (EPS) | $3.26 | $1.81 |
| $2.26 |
| Return on total assets (ROA) | 7.80% | 4.20% |
| 4.60% |
| Return on common equity (ROE) | 13.70% | 8.50% |
| 8.50% |
| Market Price/earnings (P/E) ratio | 10.5 | 10 |
| 12.5 |
| Market/book (M/B) ratio | 1.25 | 0.85 |
| 1.3 |
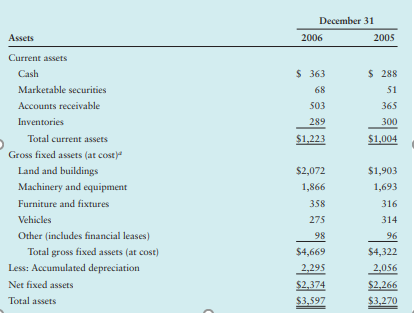
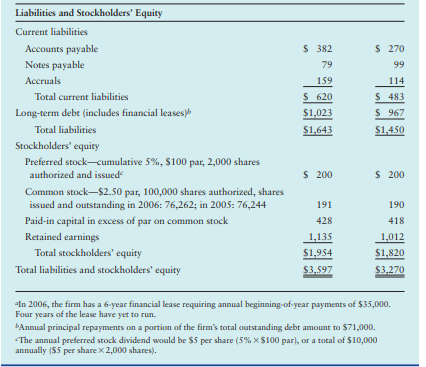
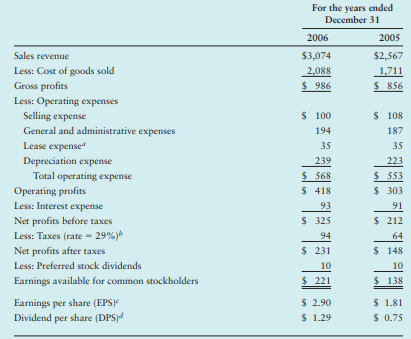
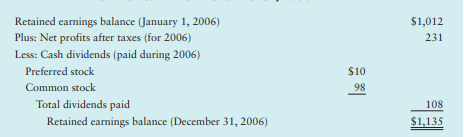
December 31 2006 2005 Assets $363 68 503 289 $1,223 $ 288 S1 365 300 $1,004 Current assets Cash Marketable securities Accounts receivable Inventories Total current assets Gross fixed assets (at cost) Land and buildings Machinery and equipment Furniture and fixtures Vehicles Other (includes financial leases) Total gross fixed assets at cost) Less: Accumulated depreciation Net fixed assets Total assets $1,903 1,693 316 314 $2,072 1,866 358 275 98 $4,669 2,295 $2,374 $3,597 96 $4,322 2,056 $2,266 $3,270 $ 382 79 159 $ 620 $1,023 $1,643 $ 270 99 114 $ 483 $ 967 $1,450 Liabilities and Stockholders' Equity Current liabilities Accounts payable Notes payable Accruals Total current liabilities Long-term debe (includes financial leases Total liabilities Stockholders' equity Preferred stock-cumulative 5%, $100 par, 2,000 shares authorized and issued Common stock-$2.50 par, 100,000 shares authorized, shares issued and outstanding in 2006: 76,262; in 2005: 76,244 Paid-in capital in excess of par on common stock Retained earnings Total stockholders' equity Total liabilities and stockholders' equity $ 200 $ 200 191 190 428 418 1,135 $1,954 $3,597 1,012 $1,820 $3,270 In 2006, the firm has a 6-year financial lease requiring annual beginning-of-year payments of $35,000. Four years of the lease have yet to run. bAnnual principal repayments on a portion of the firm's total outstanding debt amount to $71,000. The annual preferred stock dividend would be $5 per share (5% $100 par), or a total of $10,000 annually (55 per share X 2,000 shares). For the years ended December 31 2006 2005 $3,074 $2,567 2,088 1,711 $ 986 $ 856 Sales revenue Less: Cost of goods sold Gross profits Less: Operating expenses Selling expense General and administrative expenses Lease expenses Depreciation expense Total operating expense Operating profits Less: Interest expense Net profits before taxes Less: Taxes (rate - 29%) Net profits after taxes Less: Preferred stock dividends Earnings available for common stockholders Earnings per share (EPS) Dividend per share (DPS) $ 100 194 35 239 $ 568 $ 418 93 $ 325 94 $ 231 $ 108 187 35 223 $ 553 $ 303 91 $ 212 64 $ 148 10 $ 138 10 $ 221 $ 2.90 $ 1.29 $ 1.81 $ 0.75 $1,012 231 Retained earnings balance (January 1, 2006) Plus: Net profits after taxes (for 2006) Less: Cash dividends (paid during 2006) Preferred stock Common stock Total dividends paid Retained earnings balance (December 31, 2006) $10 98 108 $1,135 December 31 2006 2005 Assets $363 68 503 289 $1,223 $ 288 S1 365 300 $1,004 Current assets Cash Marketable securities Accounts receivable Inventories Total current assets Gross fixed assets (at cost) Land and buildings Machinery and equipment Furniture and fixtures Vehicles Other (includes financial leases) Total gross fixed assets at cost) Less: Accumulated depreciation Net fixed assets Total assets $1,903 1,693 316 314 $2,072 1,866 358 275 98 $4,669 2,295 $2,374 $3,597 96 $4,322 2,056 $2,266 $3,270 $ 382 79 159 $ 620 $1,023 $1,643 $ 270 99 114 $ 483 $ 967 $1,450 Liabilities and Stockholders' Equity Current liabilities Accounts payable Notes payable Accruals Total current liabilities Long-term debe (includes financial leases Total liabilities Stockholders' equity Preferred stock-cumulative 5%, $100 par, 2,000 shares authorized and issued Common stock-$2.50 par, 100,000 shares authorized, shares issued and outstanding in 2006: 76,262; in 2005: 76,244 Paid-in capital in excess of par on common stock Retained earnings Total stockholders' equity Total liabilities and stockholders' equity $ 200 $ 200 191 190 428 418 1,135 $1,954 $3,597 1,012 $1,820 $3,270 In 2006, the firm has a 6-year financial lease requiring annual beginning-of-year payments of $35,000. Four years of the lease have yet to run. bAnnual principal repayments on a portion of the firm's total outstanding debt amount to $71,000. The annual preferred stock dividend would be $5 per share (5% $100 par), or a total of $10,000 annually (55 per share X 2,000 shares). For the years ended December 31 2006 2005 $3,074 $2,567 2,088 1,711 $ 986 $ 856 Sales revenue Less: Cost of goods sold Gross profits Less: Operating expenses Selling expense General and administrative expenses Lease expenses Depreciation expense Total operating expense Operating profits Less: Interest expense Net profits before taxes Less: Taxes (rate - 29%) Net profits after taxes Less: Preferred stock dividends Earnings available for common stockholders Earnings per share (EPS) Dividend per share (DPS) $ 100 194 35 239 $ 568 $ 418 93 $ 325 94 $ 231 $ 108 187 35 223 $ 553 $ 303 91 $ 212 64 $ 148 10 $ 138 10 $ 221 $ 2.90 $ 1.29 $ 1.81 $ 0.75 $1,012 231 Retained earnings balance (January 1, 2006) Plus: Net profits after taxes (for 2006) Less: Cash dividends (paid during 2006) Preferred stock Common stock Total dividends paid Retained earnings balance (December 31, 2006) $10 98 108 $1,135
Step by Step Solution
There are 3 Steps involved in it

Get step-by-step solutions from verified subject matter experts