

Question: An experiment has a single factor with six groups and four values in each group. In determining the among-group variation, there are 5 degrees of

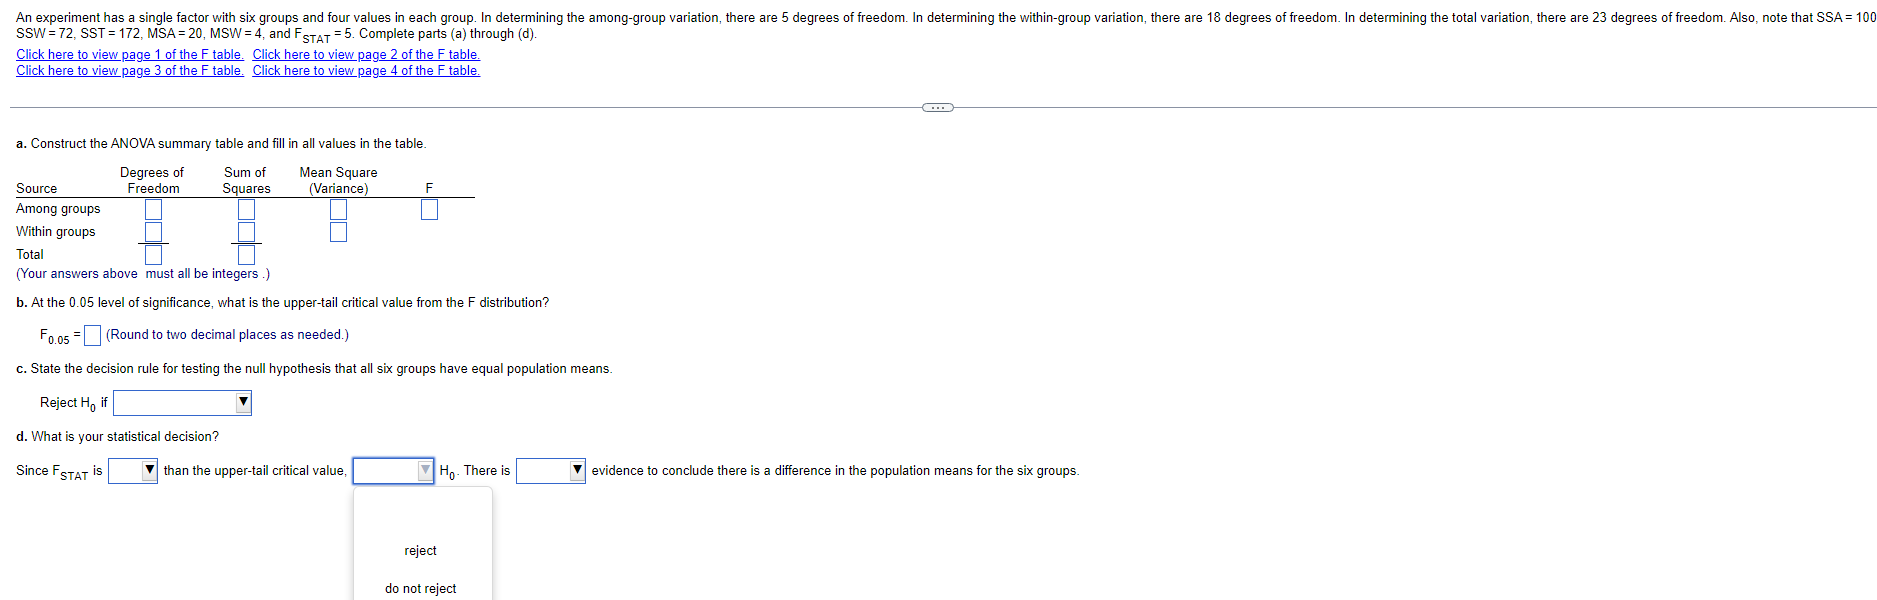

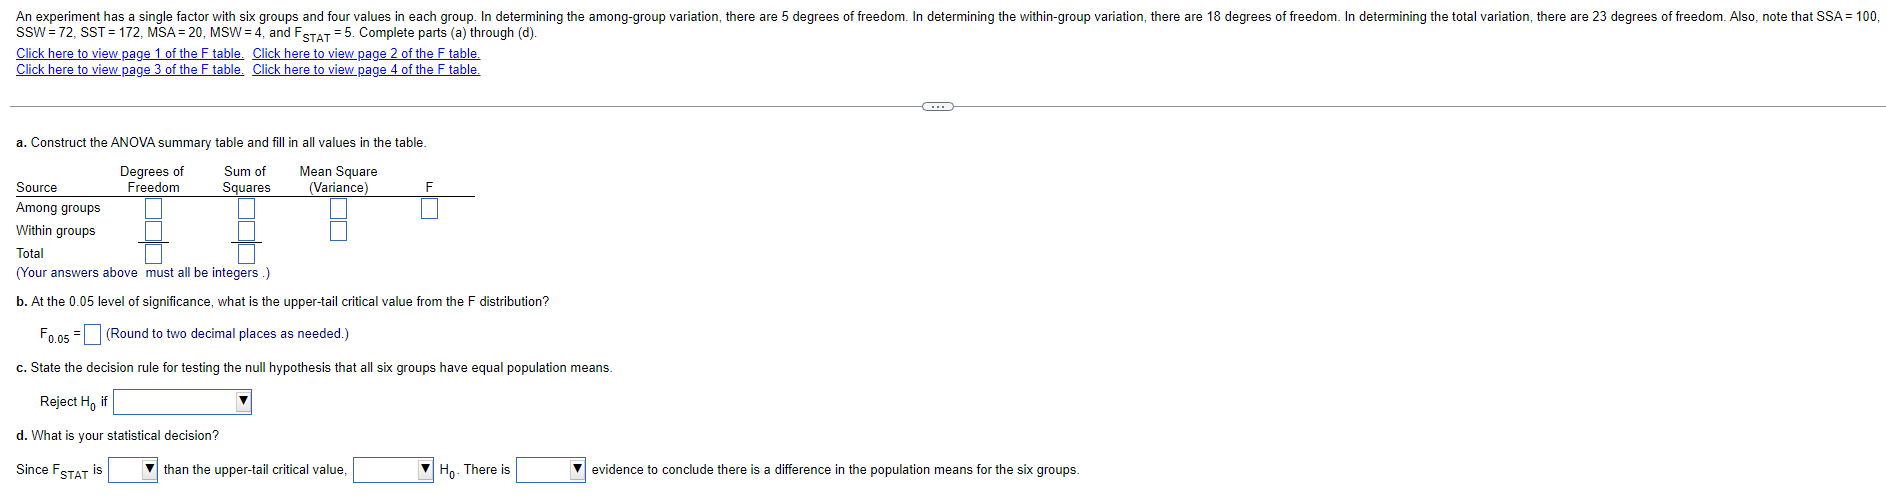
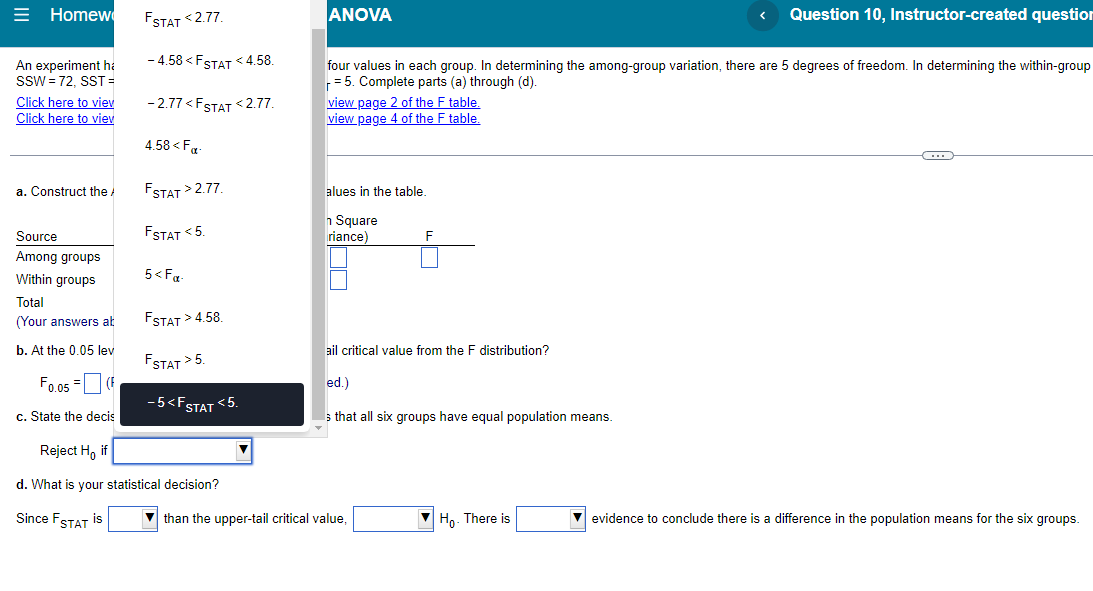
An experiment has a single factor with six groups and four values in each group. In determining the among-group variation, there are 5 degrees of freedom. In determining the within-group variation, there are 18 degrees of freedom. In determining the total variation, there are 23 degrees of freedom. Also, note that SSA = 100 SSW = 72, SST = 172, MSA = 20, MSW = 4, and FSTAT = 5. Complete parts (a) through (d). Click here to view page 1 of the F table. Click here to view page 2 of the F table. Click here to view page 3 of the F table. Click here to view page 4 of the F table. a. Construct the ANOVA summary table and fill in all values in the table. Degrees of Sum of Mean Square Source Freedom Squares (Variance) Among groups Within groups Total (Your answers above must all be integers .) b. At the 0.05 level of significance, what is the upper-tail critical value from the F distribution? Fo.os = (Round to two decimal places as needed.) c. State the decision rule for testing the null hypothesis that all six groups have equal population means. Reject Ho if d. What is your statistical decision? Since FSTAT is than the upper-tail critical value, Ho- There is evidence to conclude there is a difference in the population means for the six groups. greater lessAn experiment has a single factor with six groups and four values in each group. In determining the among-group variation, there are 5 degrees of freedom. In determining the within-group variation, there are 18 degrees of freedom. In determining the total variation, there are 23 degrees of freedom. Also, note that SSA = 100 SSW =72, SST = 172, MSA= 20, MSW = 4, and FSTAT = 5. Complete parts (a) through (d). Click here to view page 1 of the F table. Click here to view page 2 of the F table. Click here to view page 3 of the F table. Click here to view page 4 of the F table. a. Construct the ANOVA summary table and fill in all values in the table Degrees of Sum of Mean Square Source Freedom Squares (Variance Among groups Within groups Total (Your answers above must all be integers .) b. At the 0.05 level of significance, what is the upper-tail critical value from the F distribution? Fo.0s =(Round to two decimal places as needed.) c. State the decision rule for testing the null hypothesis that all six groups have equal population means. Reject Ho if d. What is your statistical decision? Since FSTAT is than the upper-tail critical value, Ho. There is evidence to conclude there is a difference in the population means for the six groups. reject do not rejectAn experiment has a single factor with six groups and four values in each group. In determining the among-group variation, there are 5 degrees of freedom. In determining the within-group variation, there are 18 degrees of freedom. In determining the total variation, there are 23 degrees of freedom. Also, note that SSA = 100 SSW = 72, SST = 172, MSA= 20, MSW= 4, and FSTAT = 5. Complete parts (a) through (d). Click here to view page 1 of the F table. Click here to view page 2 of the F table. Click here to view page 3 of the F table. Click here to view page 4 of the F table. a. Construct the ANOVA summary table and fill in all values in the table. Degrees of Sum of Mean Square Source Freedom Squares (Variance Among groups Within groups Total (Your answers above must all be integers .) b. At the 0.05 level of significance, what is the upper-tail critical value from the F distribution? Fo.05 =(Round to two decimal places as needed.) c. State the decision rule for testing the null hypothesis that all six groups have equal population means. Reject Ho if d. What is your statistical decision? Since FSTAT is than the upper-tail critical value, Ho. There is evidence to conclude there is a difference in the population means for the six groups. sufficient insufficientAn experiment has a single factor with six groups and four values in each group. In determining the among-group variation, there are 5 degrees of freedom. In determining the within-group variation, there are 18 degrees of freedom. In determining the total variation, there are 23 degrees of freedom. Also, note that SSA = 100, SSW =72, SST = 172, MSA= 20, MSW = 4, and FSTAT = 5. Complete parts (a) through (d). Click here to view page 1 of the F table. Click here to view page 2 of the F table Click here to view page 3 of the F table. Click here to view page 4 of the F table. a. Construct the ANOVA summary table and fill in all values in the table. Degrees of Sum of Mean Square Source Freedom Squares (Variance) Among groups Within groups Total (Your answers above must all be integers .) b. At the 0.05 level of significance, what is the upper-tail critical value from the F distribution? Fo.os =(Round to two decimal places as needed.) c. State the decision rule for testing the null hypothesis that all six groups have equal population means. Reject Ho if d. What is your statistical decision? Since FSTAT is than the upper-tail critical value, Ho- There is evidence to conclude there is a difference in the population means for the six groups.E Homew FSTAT $2.77. ANOVA 2.77. alues in the table. Square Source FSTAT 4.58. b. At the 0.05 lev FSTAT > 5. ail critical value from the F distribution? Fo.05 = ed.) -5
Step by Step Solution
There are 3 Steps involved in it

Get step-by-step solutions from verified subject matter experts