

Question: An experiment was conducted in which the input was suddenly changed from 4 to 4.7 standard cubic feet per minute, SCEM, at time=5:00 minutes, and
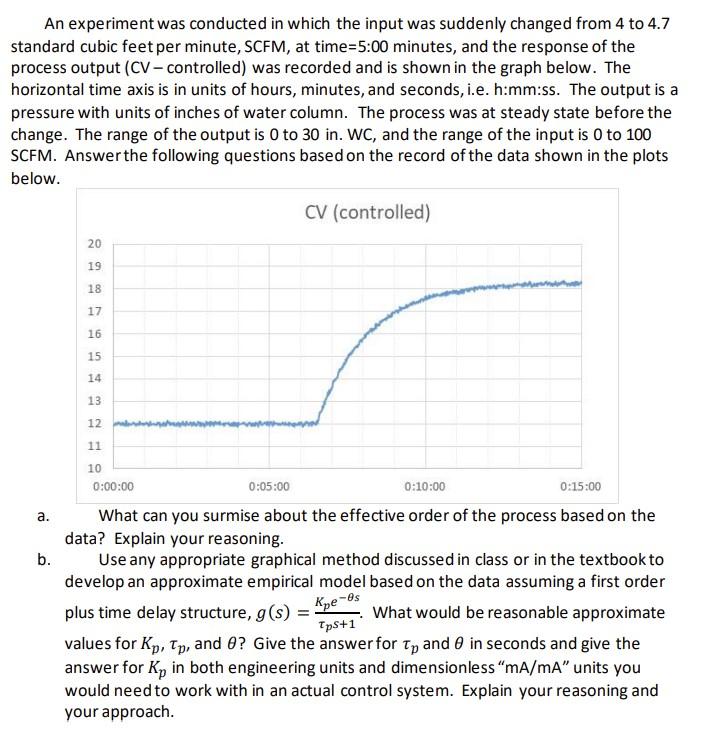
An experiment was conducted in which the input was suddenly changed from 4 to 4.7 standard cubic feet per minute, SCEM, at time=5:00 minutes, and the response of the process output (CV-controlled) was recorded and is shown in the graph below. The horizontal time axis is in units of hours, minutes, and seconds, i.e. h:mm:ss. The output is a pressure with units of inches of water column. The process was at steady state before the change. The range of the output is 0 to 30 in. Wc, and the range of the input is 0 to 100 SCFM. Answer the following questions based on the record of the data shown in the plots below. CV (controlled) 20 19 18 17 16 15 14 13 12 11 10 0:00:00 a. b. 0:05:00 0:10:00 0:15:00 What can you surmise about the effective order of the process based on the data? Explain your reasoning. Use any appropriate graphical method discussed in class or in the textbook to develop an approximate empirical model based on the data assuming a first order plus time delay structure, g(s) = Kye-os What would be reasonable approximate TpS+1 values for Kp, Tp, and O? Give the answer for Tp and 6 in seconds and give the answer for Kp in both engineering units and dimensionless mA/mA units you would need to work with in an actual control system. Explain your reasoning and your approach. An experiment was conducted in which the input was suddenly changed from 4 to 4.7 standard cubic feet per minute, SCEM, at time=5:00 minutes, and the response of the process output (CV-controlled) was recorded and is shown in the graph below. The horizontal time axis is in units of hours, minutes, and seconds, i.e. h:mm:ss. The output is a pressure with units of inches of water column. The process was at steady state before the change. The range of the output is 0 to 30 in. Wc, and the range of the input is 0 to 100 SCFM. Answer the following questions based on the record of the data shown in the plots below. CV (controlled) 20 19 18 17 16 15 14 13 12 11 10 0:00:00 a. b. 0:05:00 0:10:00 0:15:00 What can you surmise about the effective order of the process based on the data? Explain your reasoning. Use any appropriate graphical method discussed in class or in the textbook to develop an approximate empirical model based on the data assuming a first order plus time delay structure, g(s) = Kye-os What would be reasonable approximate TpS+1 values for Kp, Tp, and O? Give the answer for Tp and 6 in seconds and give the answer for Kp in both engineering units and dimensionless mA/mA units you would need to work with in an actual control system. Explain your reasoning and your approach
Step by Step Solution
There are 3 Steps involved in it

Get step-by-step solutions from verified subject matter experts