

Question: An important problem in real estate is determining how to price homes to be sold. There are so many factors?size, age, and style of the

An important problem in real estate is determining how to price homes to be
sold. There are so many factors?size, age, and style of the home; number of
bedrooms and bathrooms; size of the lot; and so on?which makes setting a price
a challenging task. In this project, we will investigate the relationships among
typical characteristics of homes and home prices, identify key variables related
to pricing, and build linear regression models to predict prices based on property
characteristics. Our analysis will be based on the Mount Pleasant Real Estate Data
(available on stat.hawkeslearning.com). This data set includes information about 245 properties for sale in
three communities in the suburban town of Mount Pleasant, South Carolina, in 2017.
1.
Download the Mount Pleasant Real Estate
Data from stat.hawkeslearning.com and open
it with Microsoft Excel.
2.
To ensure the data contains comparable
properties, eliminate duplexes and properties
whose prices are outliers. What limitations
does this impose on our analysis?
3.
The statistical tools from the current chapter
focus on numeric data, so eliminate non-
numeric variables from the data. Does this
remove potentially useful information?
4.
Are there any redundant variables we
could eliminate?
Phase 2: Discovering Relationships
5.
How strongly does each remaining variable
correlate to the price?
6.
Which variable correlates most strongly
with price?
7.
Are any variables weakly correlated with price?
Practically speaking, why do you think this
is true?
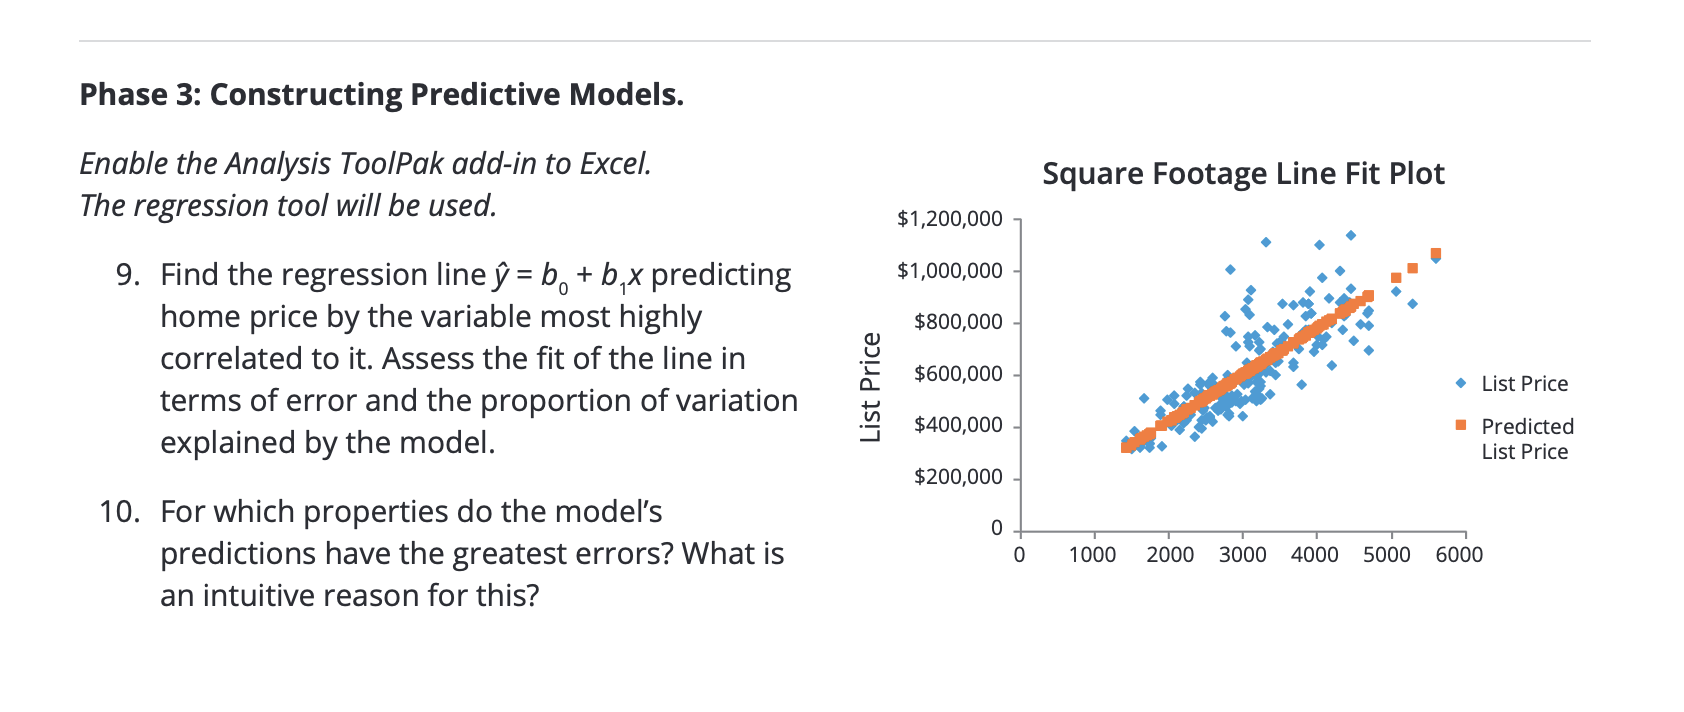
Enable the Analysis ToolPak add-in to Excel.
The regression tool will be used.
9.
Find the regression line
?
=
b
0
+
b
1
x
predicting
home price by the variable most highly
correlated to it. Assess the fit of the line in
terms of error and the proportion of variation
explained by the model.
10.
For which properties do the model's
predictions have the greatest errors? What is
an intuitive reason for this?
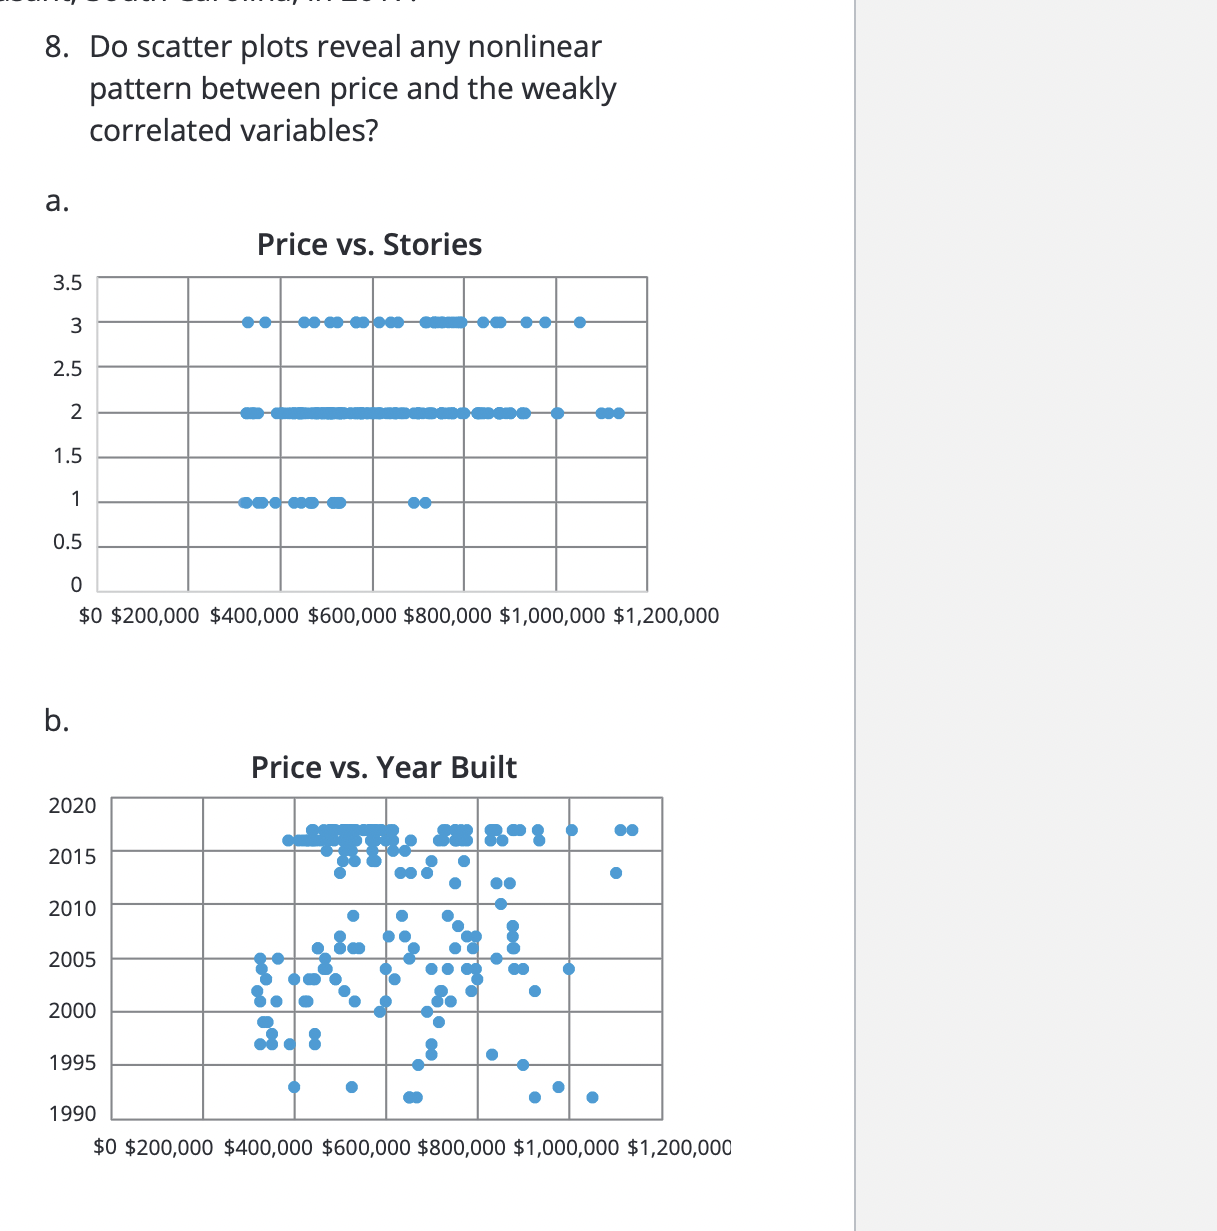
8. Do scatter plots reveal any nonlinear pattern between price and the weakly correlated variables? Price vs. Stories 0 . . . ..... . ..... $0 $200,000 $400,000 $600,000 $800,000 $1,000,000 $1,200,000 b. Price vs. Year Built 2020 201 5 201 0 2005 2000 1 995 1990 $0 $200,000 $400,000 $600,000 $800,000 $1,000,000 $1,200,000 Phase 3: Constructing Predictive Models. Enable the Analysis ToolPak odd-in to Excel. Square Footage Line Fit plot The regression tool will be used. \"1200300 9. Find the regression |ineji= bD + bx predicting \"1000.000 3' ' home price by the variable most highly $800,000 . correlated to it. Assess the fit of the line in $500 000 L. P _ n 0 ISI rice terms of error and the proportion of variation . $400,000 explained by the model. I Predicted List Price List Price $200,000 10. For which properties do the model's 0 predictions have the greatest errors? What is 0 1000 2000 3000 4000 5000 5000 an intuitive reason for this
Step by Step Solution
There are 3 Steps involved in it

Get step-by-step solutions from verified subject matter experts