

An investor has approached you about whether purchasing stock in the company would be a wise investment.
Question:
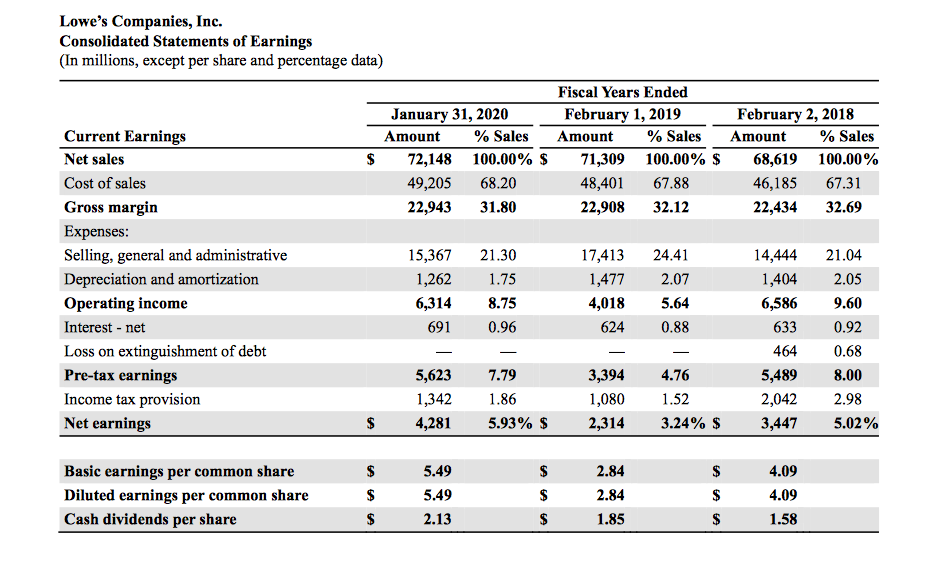
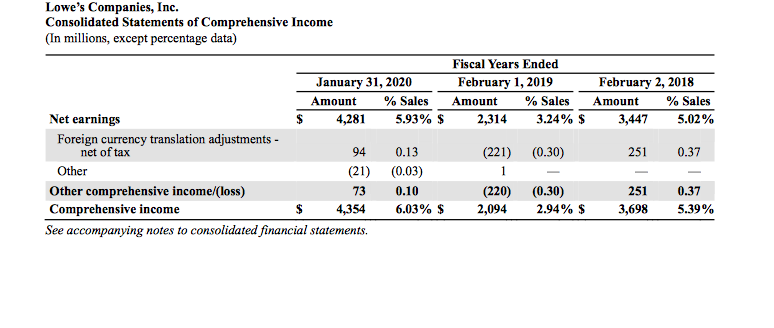
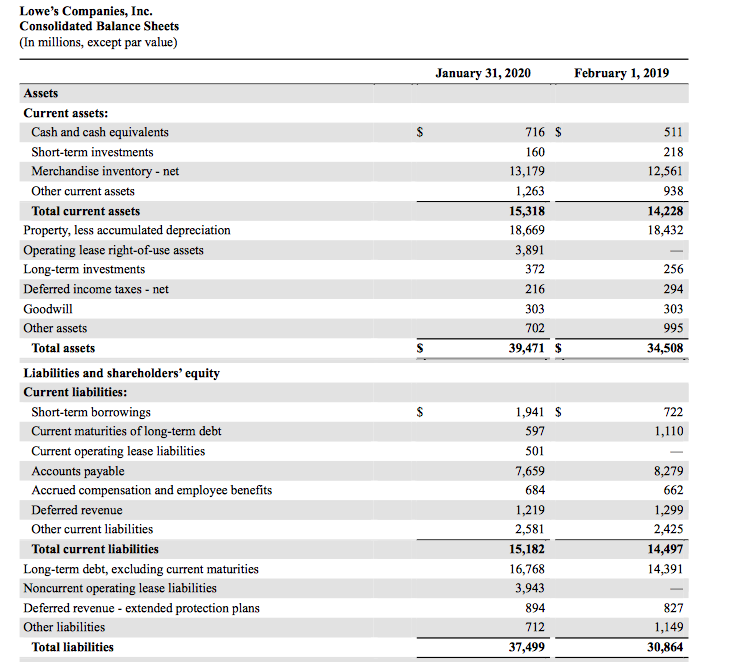
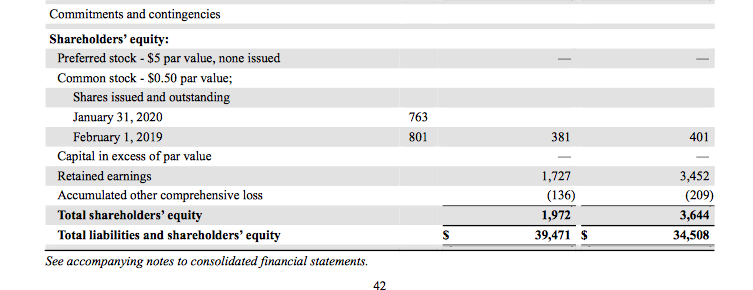
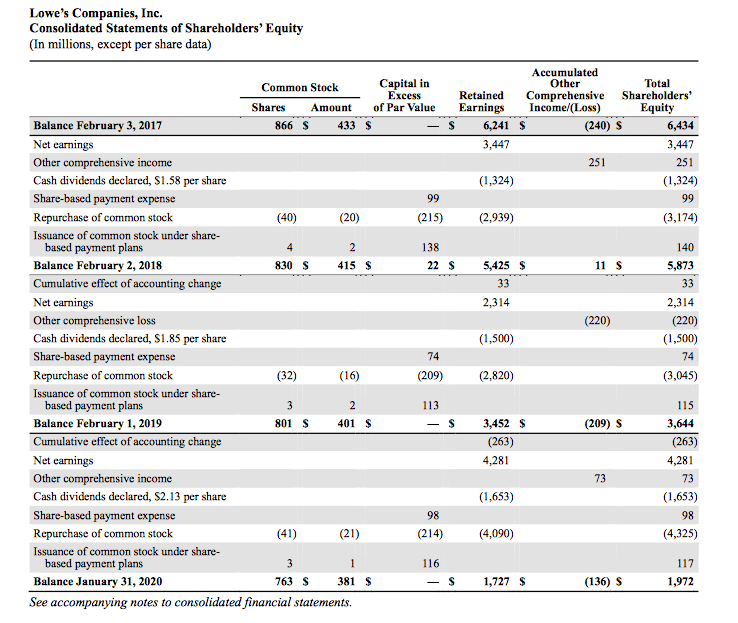
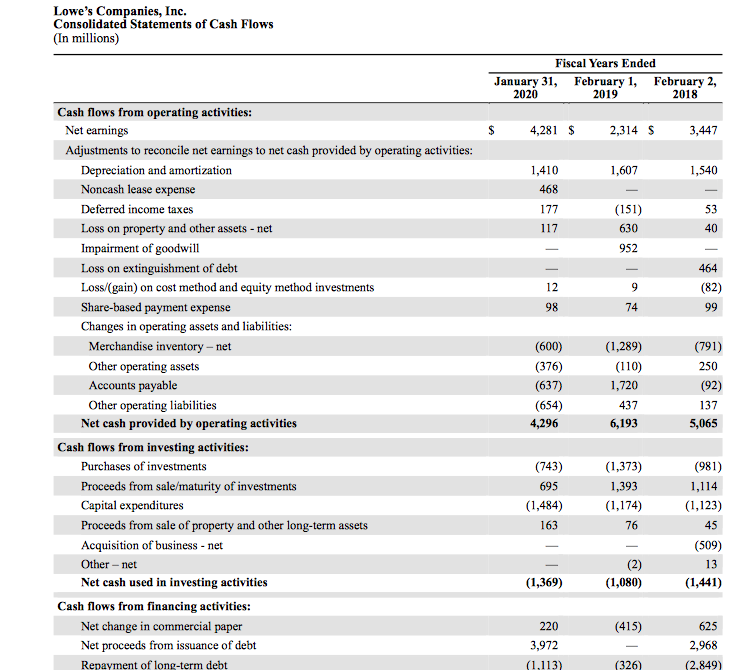
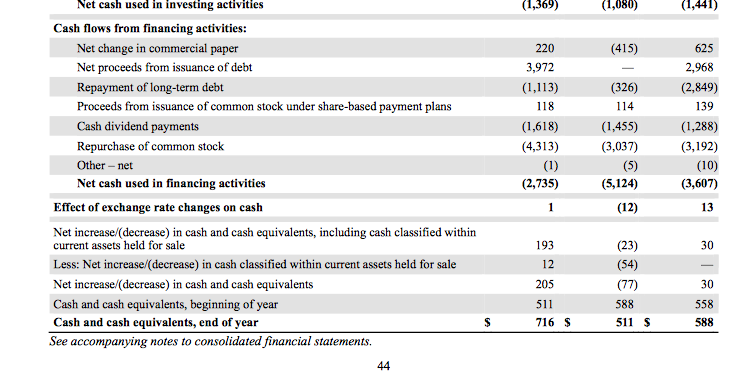
An investor has approached you about whether purchasing stock in the company would be a wise investment. Using your financial analysis of the company, you will send a letter to the investor summarizing your findings and explaining whether you recommend a stock purchase at this time. Refer to the ?Annual Reports for Approved Companies? located in the course materials. You will use information in the Form 10-K to complete this assignment. Using the correct formulas and a separate tab for each analysis, calculate the following ratios using Excel
You will use information in the Form 10-K for the company you selected in the Topic 1 to complete this assignment. Using the correct formulas and a separate tab for each analysis, calculate the following ratios using Excel:
- Three liquidity ratios for the past 2 years
- Three solvency ratios for the past 2 years
- Three profitability ratios for the past 2 years
In addition, conduct research about a competitor company within the same sector using IBIS World and other topic resources. Complete a competitor analysis that includes a minimum of three ratios and compares your company to a competitor company using these ratios to determine financial performance as well as how the company compares to overall industry averages. Justify your analysis by explaining your findings.
Using your research findings and analysis of company performance in relation to industry competitors, construct a 500-750 word letter making stock purchase recommendations for a potential investor. In the letter, address the following, referencing specific ratios and comparative numbers as appropriate.
- Discuss the overall financial performance of your company in relation to industry averages and a specific competitor. Explain whether the company performed better or worse than the competition using specific numbers and providing an explanation of what the numbers illustrate.
- Recommend whether the potential investor should purchase stock in your company and justify your recommendation based upon your research and analysis of the company ratios and industry competition.
Expert Answer:
Figin mlns 31Dec16 30Dec17 Dec 292018 Analysis 1Current assets 35508 29500 28787 2Current liabilities 20302 17421 16626 Liquidity ratios 3Current asse... View the full answer


Cornerstones of Managerial Accounting
ISBN: 978-1305103962
6th edition
Authors: Maryanne M. Mowen, Don R. Hansen, Dan L. Heitger
