

Analyse of the financial ratios of Apple Inc. Each team will be required to examine Apples most
Question:
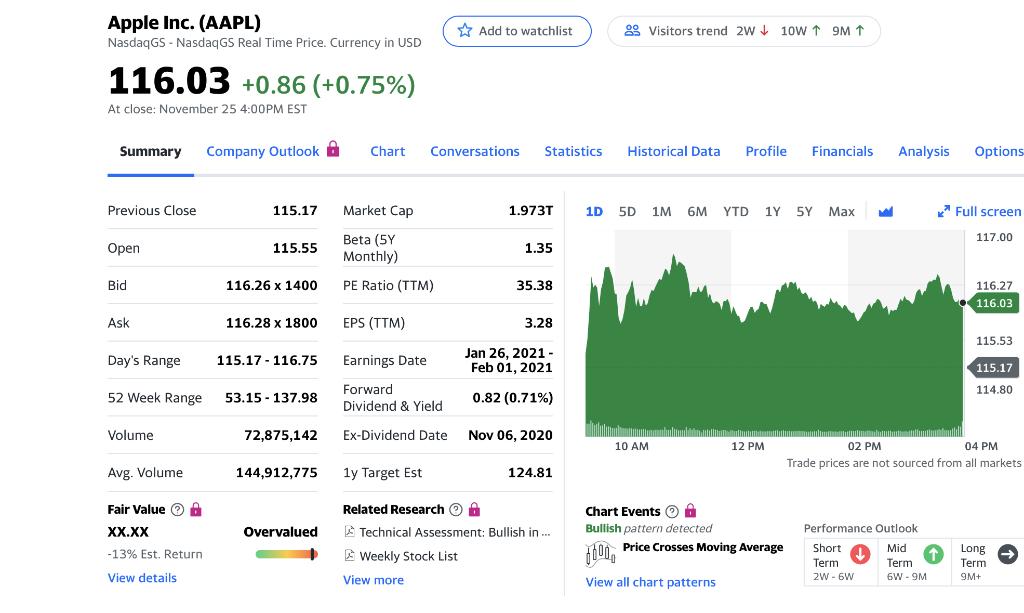
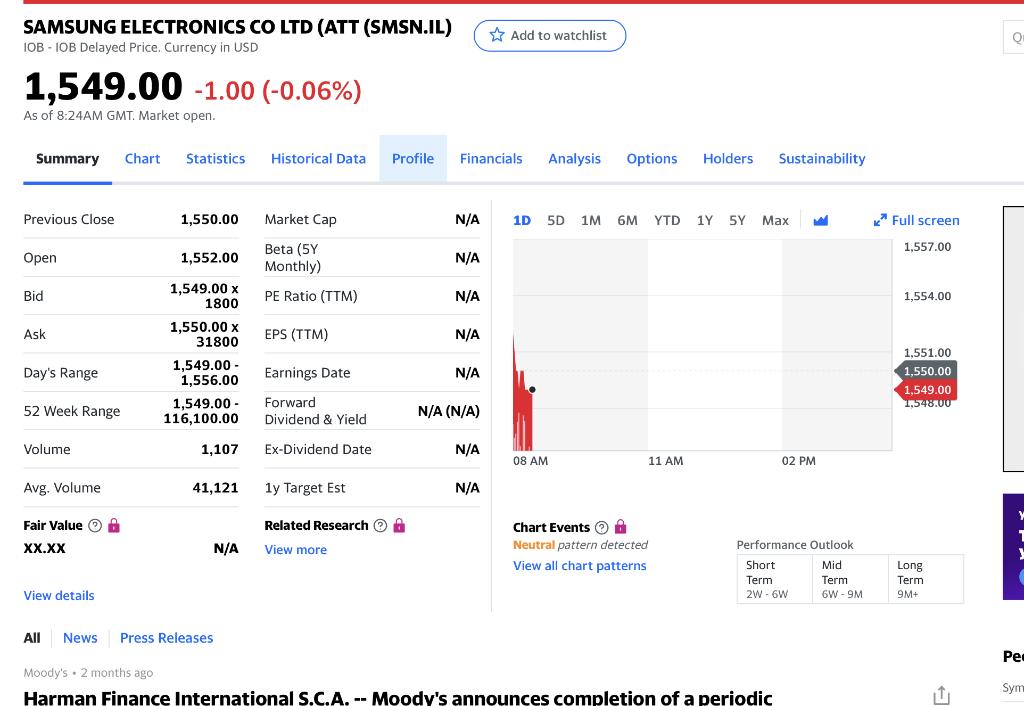 Analyse of the financial ratios of Apple Inc. Each team will be required to examine Apple’s most recently published financial statements and calculate the ratios identified at the back of this project. Having done that, you are required to do the same for a competitor, one of either Alphabet Inc. or Samsung Electronics Co., Ltd.
Find the current Annual Reports and financial information for apple and Samsung
Once each team has performed an analysis of the financial statements, you are asked to provide a written report summarizing the team’s findings. The written report will include:
- Title page (including Apple and the name of the business chosen as a comparison company, and the full names of all students in the group):
- Calculation of the financial ratios of both Apple and one of its competitors (either Alphabet or Samsung). Written proof of how the ratios were calculated MUST be attached to the report, using the attached work page:
- An analysis and interpretation of the financial ratios you have calculated. The analysis of the financial ratios should include insights into the meanings behind the ratios. The ratios should tell a story about how Apple is currently doing and offer a guide to its prospects for the future. You need to tell that story. You should not comment on all the ratios you calculated – just the ones that provide the most significant insights.
This will be about 3 pages long (double–spaced). You should break this up into 3 sections:
Liquidity and Efficiency (approximately one page)
Solvency (approximately two-thirds of a page)
Profitability (approximately one page)
- Investment recommendation. This will probably be about a half to a full page long (double–spaced). Would you recommend purchasing stocks of Apple? Explain why or why not. You could refer here to the Market Prospects ratio calculated in Part 1. What do you feel are the attractions of Apple stocks? You might want to show information on the movement over time of Apple’s stock price in this section: 6 points
Each of the above sections (1 to 4) must appear on a new page. In allocating points to the above four areas, I will take into consideration not only the content of your report but also the quality of the work’s presentation. I will be looking for a report that is well-written, is well organized, and appears as though it has been thoroughly edited before submission.
Evidence of Ratio Calculations: Please show your calculations of the financial ratios of Apple Inc. and either Alphabet or Samsung Electronics below. Please attach this sheet to the back of your written project.
These are the data to use and search up the rest
Ratio | Apple Inc. | Alphabet Inc. or Samsung Electronics |
LIQUIDITY AND EFFICIENCY | ||
Current Ratio | ||
Acid-Test Ratio | ||
Accounts Receivable Turnover | ||
Total Asset Turnover | ||
Ratio | Apple Inc. | Alphabet Inc. or Samsung Electronics |
SOLVENCY | ||
Debt Ratio | ||
Debt-to-Equity Ratio | ||
PROFITABILITY | ||
Profit Margin Ratio | ||
Return- on -Total Assets Ratio | ||
Gross Profit Ratio a.k.a. Gross Margin Ratio | ||
Ratio | Apple Inc. | Alphabet Inc. or Samsung Electronics |
Return-on-Common Stockholders’ Equity Ratio | NOT REQUIRED | |
Basic Earnings Per Share | ||
MARKET PROSPECTS | ||
Price/Earnings Ratio (Search for common stock price at the date of the financial statements) | NO REQUIRED | |
Expert Answer:
Ans How to analyse the ratios and how to interpret the ratios The ratios are divided into mainly thr... View the full answer


Accounting Principles
ISBN: 978-0470533475
9th Edition
Authors: Jerry J. Weygandt, Paul D. Kimmel, Donald E. Kieso
