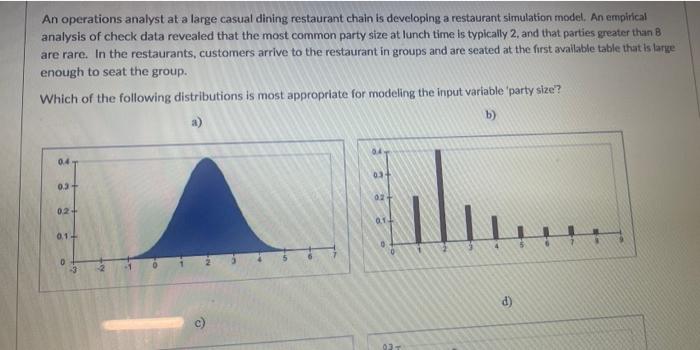
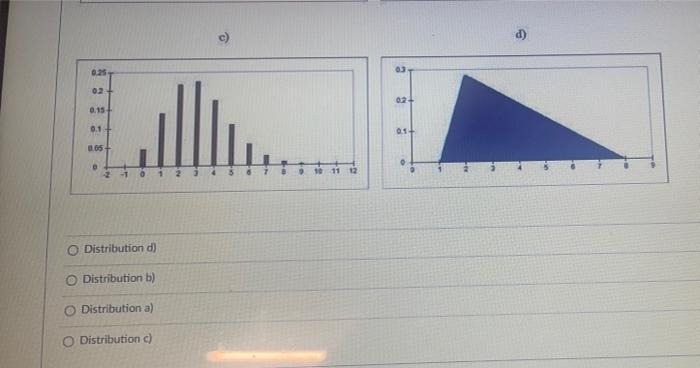
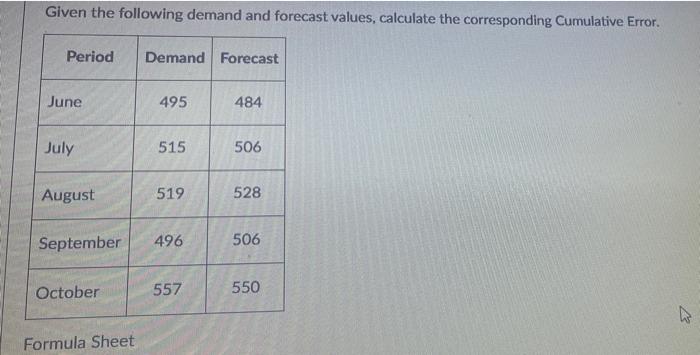
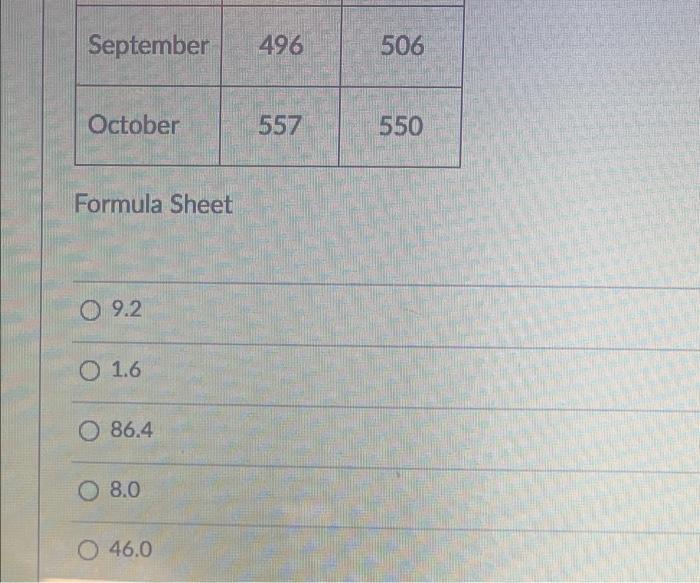
Question: An operations analyst at a large casual dining restaurant chain is developing a restaurant simulation model. An empirical analysis of check data revealed that the

An operations analyst at a large casual dining
An operations analyst at a large casual dining restaurant chain is developing a restaurant simulation model. An empirical analysis of check data revealed that the most common party size at lunch time is typically 2, and that parties greater than 8 are rare. In the restaurants, customers arrive to the restaurant in groups and are seated at the first available table that is large enough to seat the group. Which of the following distributions is most appropriate for modeling the input variable 'party size? a) b) 0.4 0.3+ 0.2+ 0,1+ 0 1...... 03- 03 T d) 0.25- 02 0.15+ 0.1 0.05 D 210123 Distribution d) O Distribution b) Distribution a) Distribution c) !1. 02- 01+ Given the following demand and forecast values, calculate the corresponding Cumulative Error. Period Demand Forecast June July August October 495 Formula Sheet 515 September 496 519 557 484 506 528 506 550 M September October Formula Sheet 9.2 1.6 O 86.4 O 8.0 O 46.0 496 557 506 550

Step by Step Solution

There are 3 Steps involved in it

1 Expert Approved Answer
Step: 1 Unlock blur-text-image
Question Has Been Solved by an Expert!

Get step-by-step solutions from verified subject matter experts

Step: 2 Unlock
Step: 3 Unlock

Students Have Also Explored These Related General Management Questions!