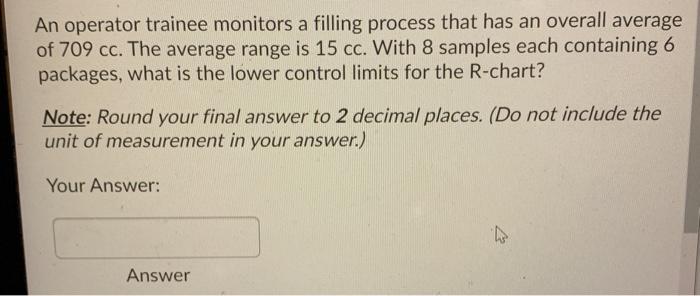
Question: An operator trainee monitors a filling process that has an overall average of 709 cc. The average range is 15 cc. With 8 samples each

An operator trainee monitors a filling process
An operator trainee monitors a filling process that has an overall average of 709 cc. The average range is 15 cc. With 8 samples each containing 6 packages, what is the lower control limits for the R-chart? Note: Round your final answer to 2 decimal places. (Do not include the unit of measurement in your answer.) Your Answer: Answer Telephone inquiries of 100 CRA"customers" are monitored daily at random. Incidents of incorrect information or other nonconformities (such as impoliteness to customers) are recorded. The data for last week follow: Day 1 N No. of Nonconformities 2 6 16 20 9 4. 5 Choose the right control chart to monitor the daily number of nonconfirmities, and calculate the upper control limit of the chart for the confidence level 99.73%. Note: Round your response to two decimal places. Your

Step by Step Solution

There are 3 Steps involved in it

1 Expert Approved Answer
Step: 1 Unlock blur-text-image
Question Has Been Solved by an Expert!

Get step-by-step solutions from verified subject matter experts

Step: 2 Unlock
Step: 3 Unlock

Students Have Also Explored These Related General Management Questions!