

Question: An organization has increased its profitability dramatically by using models to allocate its sales force among the companys major drugs. To guide that effort, a
An organization has increased its profitability dramatically by using models to allocate its sales force among the companys major drugs. To guide that effort, a non-linear sales response curve is estimated for each drug. A sales-response curve relates the sale of a product to the effort expended to sell it, which in this case is measured by the number of calls made by the sales force. The following figure shows the typical shape of such a curve:
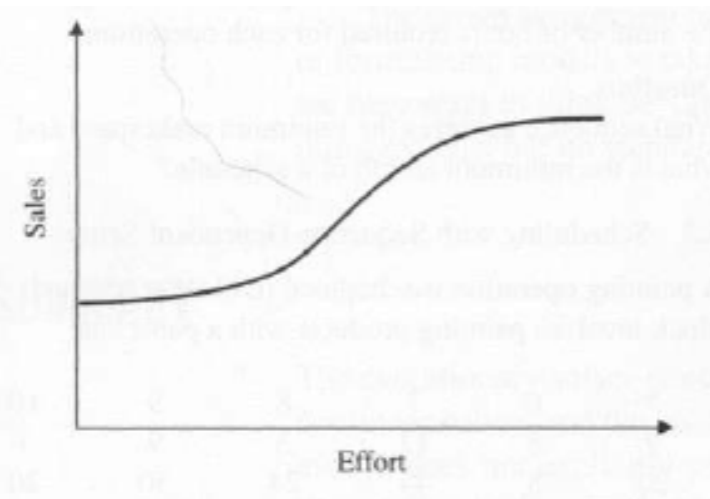
For low levels of effort, sales rise rapidly with increased effort, but eventually the sales response levels out. Two elements are needed to develop a sales-response curve for a particular product: (1) some data or managerial judgments on the sales at various levels of effort and (2) a family of S-shaped curves to fit the data. A suitable family of curves for the organization is given by the function:
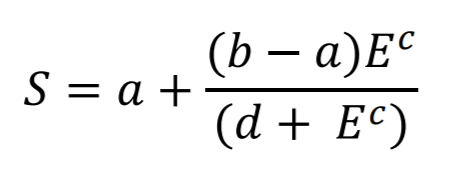
where S is sales, E is effort, and a, b, c, and d are parameters that determine the shape and location of the curve. At the organization, sales of a particular drug were around 200 cases with a sales effort of 500 calls. Management was then asked to estimate sales at other levels of effort. Their estimates are as follows:
| Effort (%) | Actual Sales (% of Current) |
|---|---|
| 0 | 50 |
| 25 | 53 |
| 50 | 55 |
| 75 | 75 |
| 100 | 100 |
| 125 | 120 |
| 150 | 127 |
| 175 | 132 |
| 200 | 135 |
Using the Evolutionary solver with ASPE in Microsoft Excel, solve both questions (a) and (b) below. Your solution should contain a detailed spreadsheet model (where the decision variables, parameters, objective function and constraints are identified and explained), as well as answers to the questions posed.
(a) Fit a sales-response curve to the data above using a least-squares criterion. Use percentages relative to the base case for the effort and sales measures. What are the best values of the parameters a, b, c, and d?
(b) What sales does the model in part (a) predict for an effort of 115%?
Effort
Step by Step Solution
There are 3 Steps involved in it

Get step-by-step solutions from verified subject matter experts