

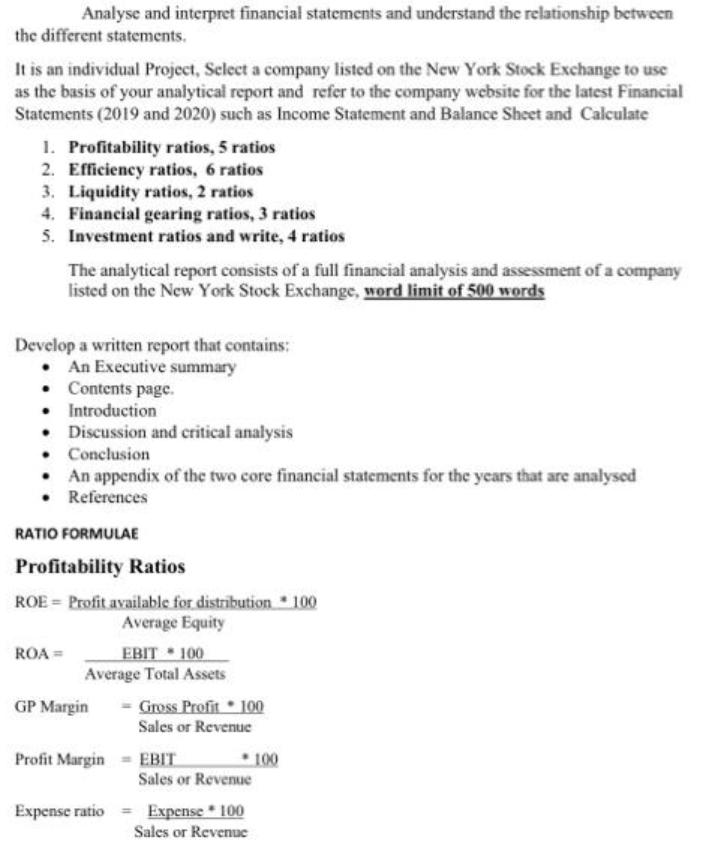
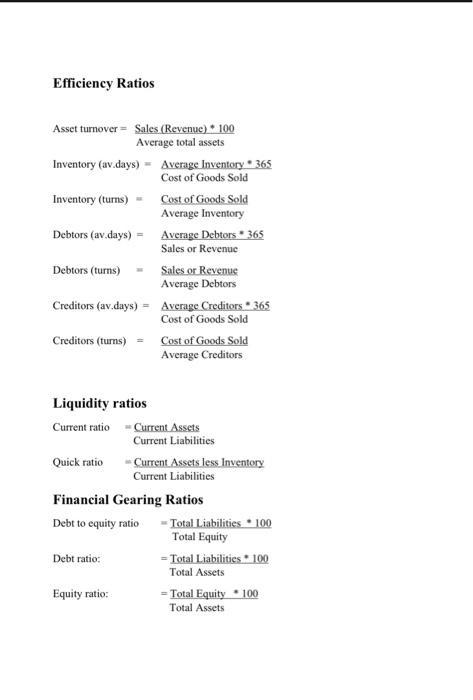
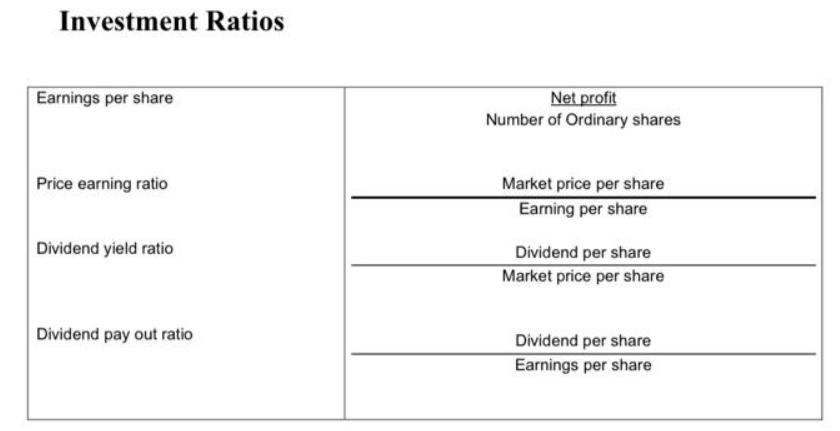
Analyse and interpret financial statements and understand the relationship between the different statements. It is an...
Fantastic news! We've Found the answer you've been seeking!
Question:
Transcribed Image Text:
Analyse and interpret financial statements and understand the relationship between the different statements. It is an individual Project, Select a company listed on the New York Stock Exchange to use as the basis of your analytical report and refer to the company website for the latest Financial Statements (2019 and 2020) such as Income Statement and Balance Sheet and Calculate 1. Profitability ratios, 5 ratios 2. Efficiency ratios, 6 ratios 3. Liquidity ratios, 2 ratios 4. Financial gearing ratios, 3 ratios 5. Investment ratios and write, 4 ratios The analytical report consists of a full financial analysis and assessment ofa company listed on the New York Stock Exchange, word limit of 500 words Develop a written report that contains: • An Executive summary • Contents page. • Introduction • Discussion and critical analysis • Conclusion • An appendix of the two core financial statements for the years that are analysed • References RATIO FORMULAE Profitability Ratios ROE = Profit available for distribution 100 Average Equity EBIT 100 Average Total Assets ROA = Gross Profit • 100 Sales or Revenue GP Margin Profit Margin - EBIT 100 Sales or Revenue Expense ratio = Expense 100 Sales or Revenue Efficiency Ratios Asset turnover Sales (Revenue) * 100 Average total assets Inventory (av.days) = Average Inventory 365 Cost of Goods Sold Cost of Goods Sold Average Inventory Inventory (turns) Debtors (av.days) - Average Debtors 365 Sales or Revenue Sales or Revenue Average Debtors Debtors (turns) Creditors (av.days) - Average Creditors 365 Cost of Goods Sold Creditors (turns) = Cost of Goods Sold Average Creditors Liquidity ratios Current Assets Current Liabilities Current ratio Current Assets less Inventory Current Liabilities Quick ratio Financial Gearing Ratios - Total Liabilities • 100 Total Equity Debt to equity ratio Debt ratio: = Total Liabilities 100 Total Assets Equity ratio: = Total Equity • 100 Total Assets Investment Ratios Earnings per share Net profit Number of Ordinary shares Market price per share Earning per share Price earning ratio Dividend yield ratio Dividend per share Market price per share Dividend pay out ratio Dividend per share Earnings per share Analyse and interpret financial statements and understand the relationship between the different statements. It is an individual Project, Select a company listed on the New York Stock Exchange to use as the basis of your analytical report and refer to the company website for the latest Financial Statements (2019 and 2020) such as Income Statement and Balance Sheet and Calculate 1. Profitability ratios, 5 ratios 2. Efficiency ratios, 6 ratios 3. Liquidity ratios, 2 ratios 4. Financial gearing ratios, 3 ratios 5. Investment ratios and write, 4 ratios The analytical report consists of a full financial analysis and assessment ofa company listed on the New York Stock Exchange, word limit of 500 words Develop a written report that contains: • An Executive summary • Contents page. • Introduction • Discussion and critical analysis • Conclusion • An appendix of the two core financial statements for the years that are analysed • References RATIO FORMULAE Profitability Ratios ROE = Profit available for distribution 100 Average Equity EBIT 100 Average Total Assets ROA = Gross Profit • 100 Sales or Revenue GP Margin Profit Margin - EBIT 100 Sales or Revenue Expense ratio = Expense 100 Sales or Revenue Efficiency Ratios Asset turnover Sales (Revenue) * 100 Average total assets Inventory (av.days) = Average Inventory 365 Cost of Goods Sold Cost of Goods Sold Average Inventory Inventory (turns) Debtors (av.days) - Average Debtors 365 Sales or Revenue Sales or Revenue Average Debtors Debtors (turns) Creditors (av.days) - Average Creditors 365 Cost of Goods Sold Creditors (turns) = Cost of Goods Sold Average Creditors Liquidity ratios Current Assets Current Liabilities Current ratio Current Assets less Inventory Current Liabilities Quick ratio Financial Gearing Ratios - Total Liabilities • 100 Total Equity Debt to equity ratio Debt ratio: = Total Liabilities 100 Total Assets Equity ratio: = Total Equity • 100 Total Assets Investment Ratios Earnings per share Net profit Number of Ordinary shares Market price per share Earning per share Price earning ratio Dividend yield ratio Dividend per share Market price per share Dividend pay out ratio Dividend per share Earnings per share
Expert Answer:

Posted Date:
Students also viewed these accounting questions
-
The Horizon Company is listed on the New York Stock Exchange. The market value of its common stock was quoted at $18 per share at both December 31, 2007 and December 31, 2006. Horizons balance sheets...
-
The Printing Company is listed on the New York Stock Exchange. The market value of its common stock was quoted at $10 per share at December 31, 2007 and 2006. Printing's balance sheet at December 31,...
-
An incomplete comparative income statement and balance sheet for Amherst Corporation follow: Requirement 1. Using the ratios, common-size percentages, and trend percentages given, complete the income...
-
Onefifth of a hive of bees flew to the Kadamba flower; one-third flew to the Silandhara; three times the difference of these two numbers flew to an arbor, and one bee continued flying about,...
-
Do an Internet search for information on IFRS. Visit at least two Web sites, including the International Accounting Standards Board, and respond to the following questions about IFRS: a. Compare and...
-
Megalopolis Bank has the following balance sheet and income statement. For Megalopolis, calculate: a. Return on equity b. Return on assets c. Asset utilization d. Equity multiplier e. Profit margin...
-
Visit the website of one of the online marketing research firms (e.g., Toluna at us.toluna .com/default.aspx or www.toluna.com). Locate a survey administered currently at this site. Critically...
-
Hawkeye Networks is a U.S. corporation with no foreign-source income of its own, but it does have wholly owned subsidiaries in Korea and Singapore. The Korean subsidiary has $43 million of pre-tax...
-
What is Capital Structure and how important it is? What is the basic goal of financial management with regard to capital structure? How is the cost of capital related to capital structure? Question...
-
Schmidt Company began operations on January 1, 2006 and used the LIFO inventory method for both financial reporting and income taxes. However, at the beginning of 2008 the company decided to switch...
-
Imagine a world where your thoughts are not echoes of others, where your decisions are anchored in your own personal convictions, and your emotional compass remains steady amidst the digital tide....
-
What other criticisms do you think may be made against the classical universal approach to the design of organisational structure?
-
Mary Beth is a CPA, devoting 3,000 hours per year to her practice. She also owns an office building in which she rents out space to tenants. She devotes none of her time to the management of the...
-
List the eight wastes according to lean philosophy.
-
Of what value is this general grouping of national cultures to managers in their SIHRM activities?
-
How would you summarise the key differences between the classical universal, contingency and consistency approaches to the design of organisational structure?
-
What is the DV01 of a 3-year 8% annual coupon bond with a $1,000face value and yield to maturity of 6%? Round to three decimalplaces. Try not to round until final answer ?[Hint: First computethe 0...
-
Establish identity. cos( + k) = (-1)k cos , k any integer
-
W hat is diauxic growth? Explain the roles of cAMP and CAP in this process.
-
What is antisense RNA? How does it affect the translation of a complementary mRNA?
-
What are the functions of activator proteins and repressor proteins in transcription? Explain how these proteins work at the molecular level.

Study smarter with the SolutionInn App