

Question: Analyse multi year 2000-2004 financial statements.Do you think this has strong fundamentals to create value and why? 132 art Two Financial Analy Kuala Paja EXHIBIT

Analyse multi year 2000-2004 financial statements.Do you think this has strong fundamentals to create value and why?
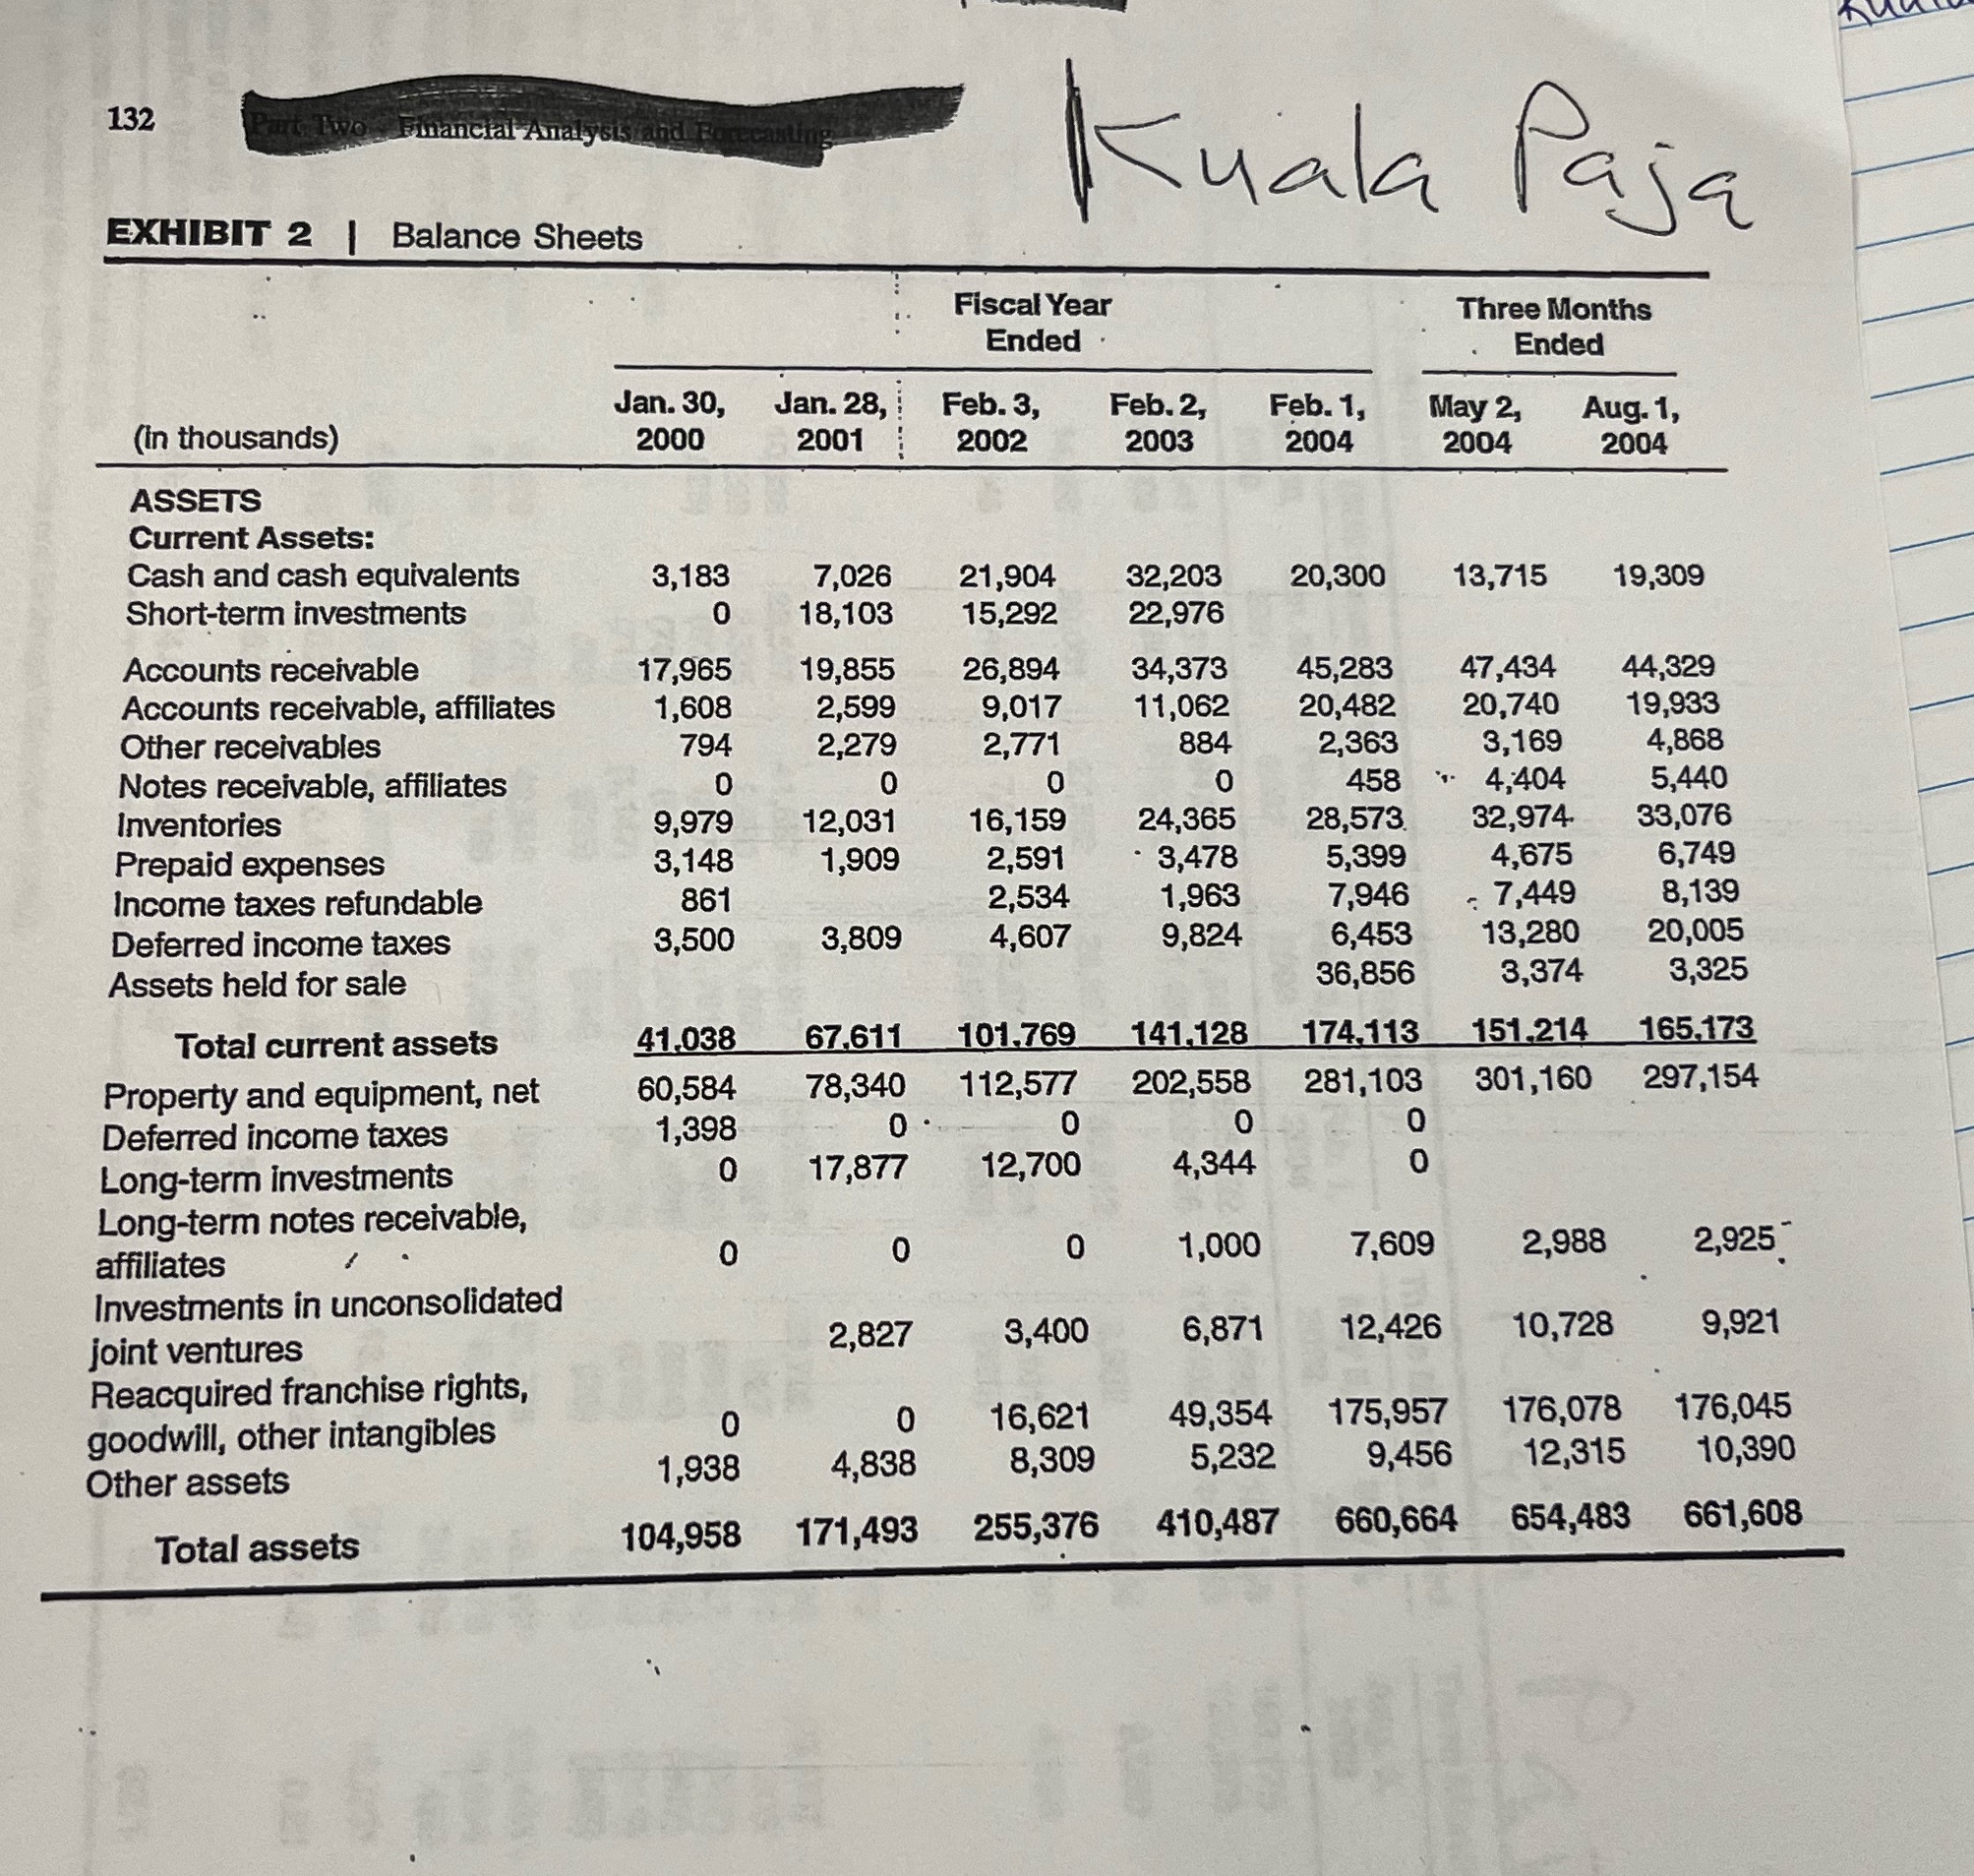
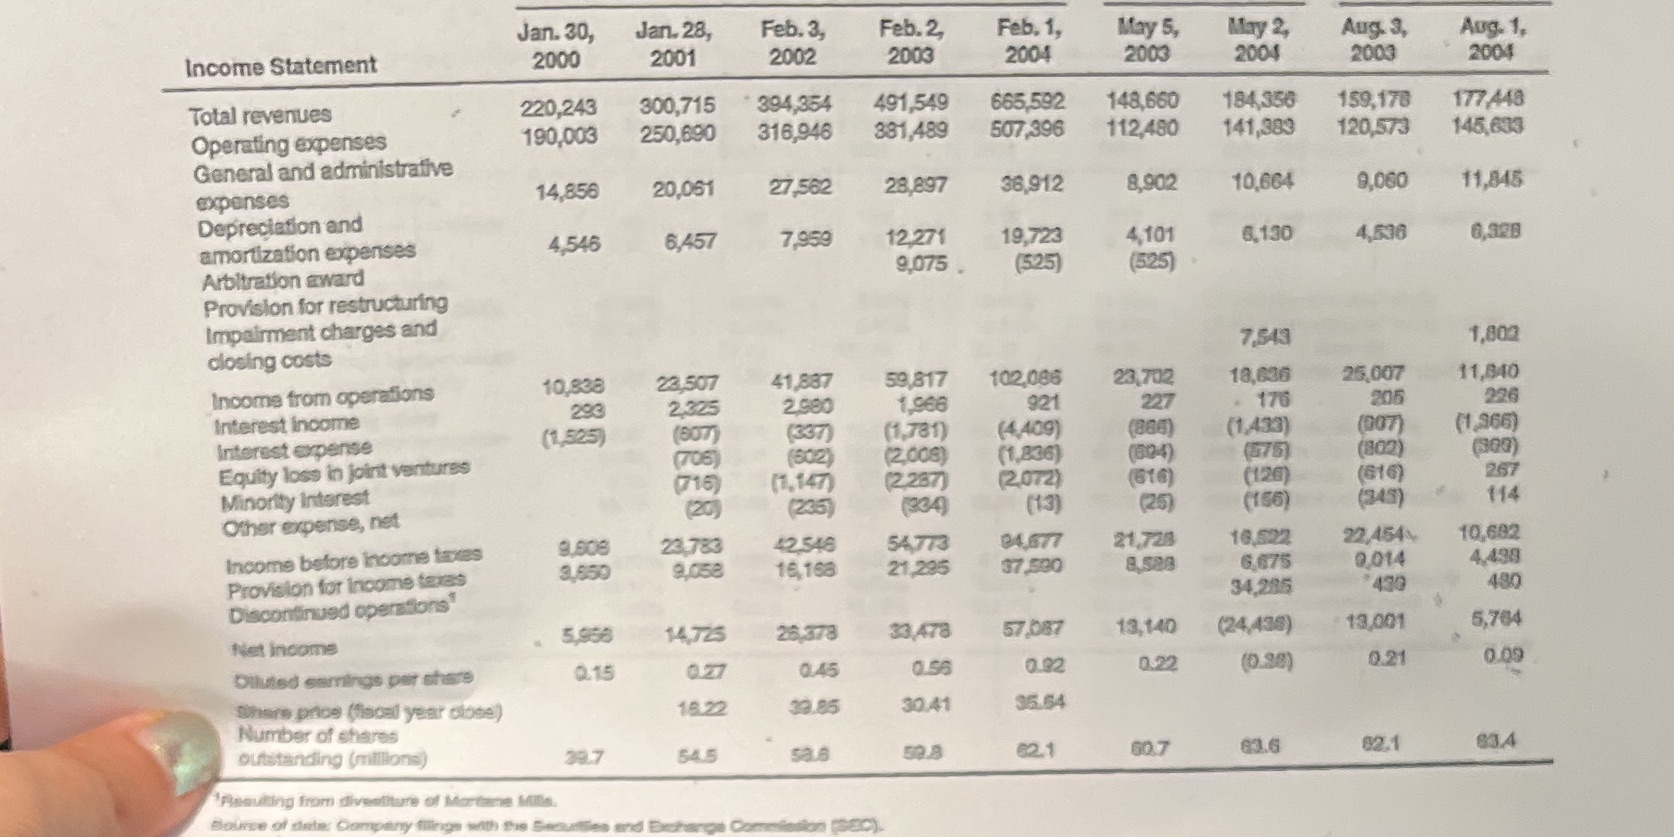
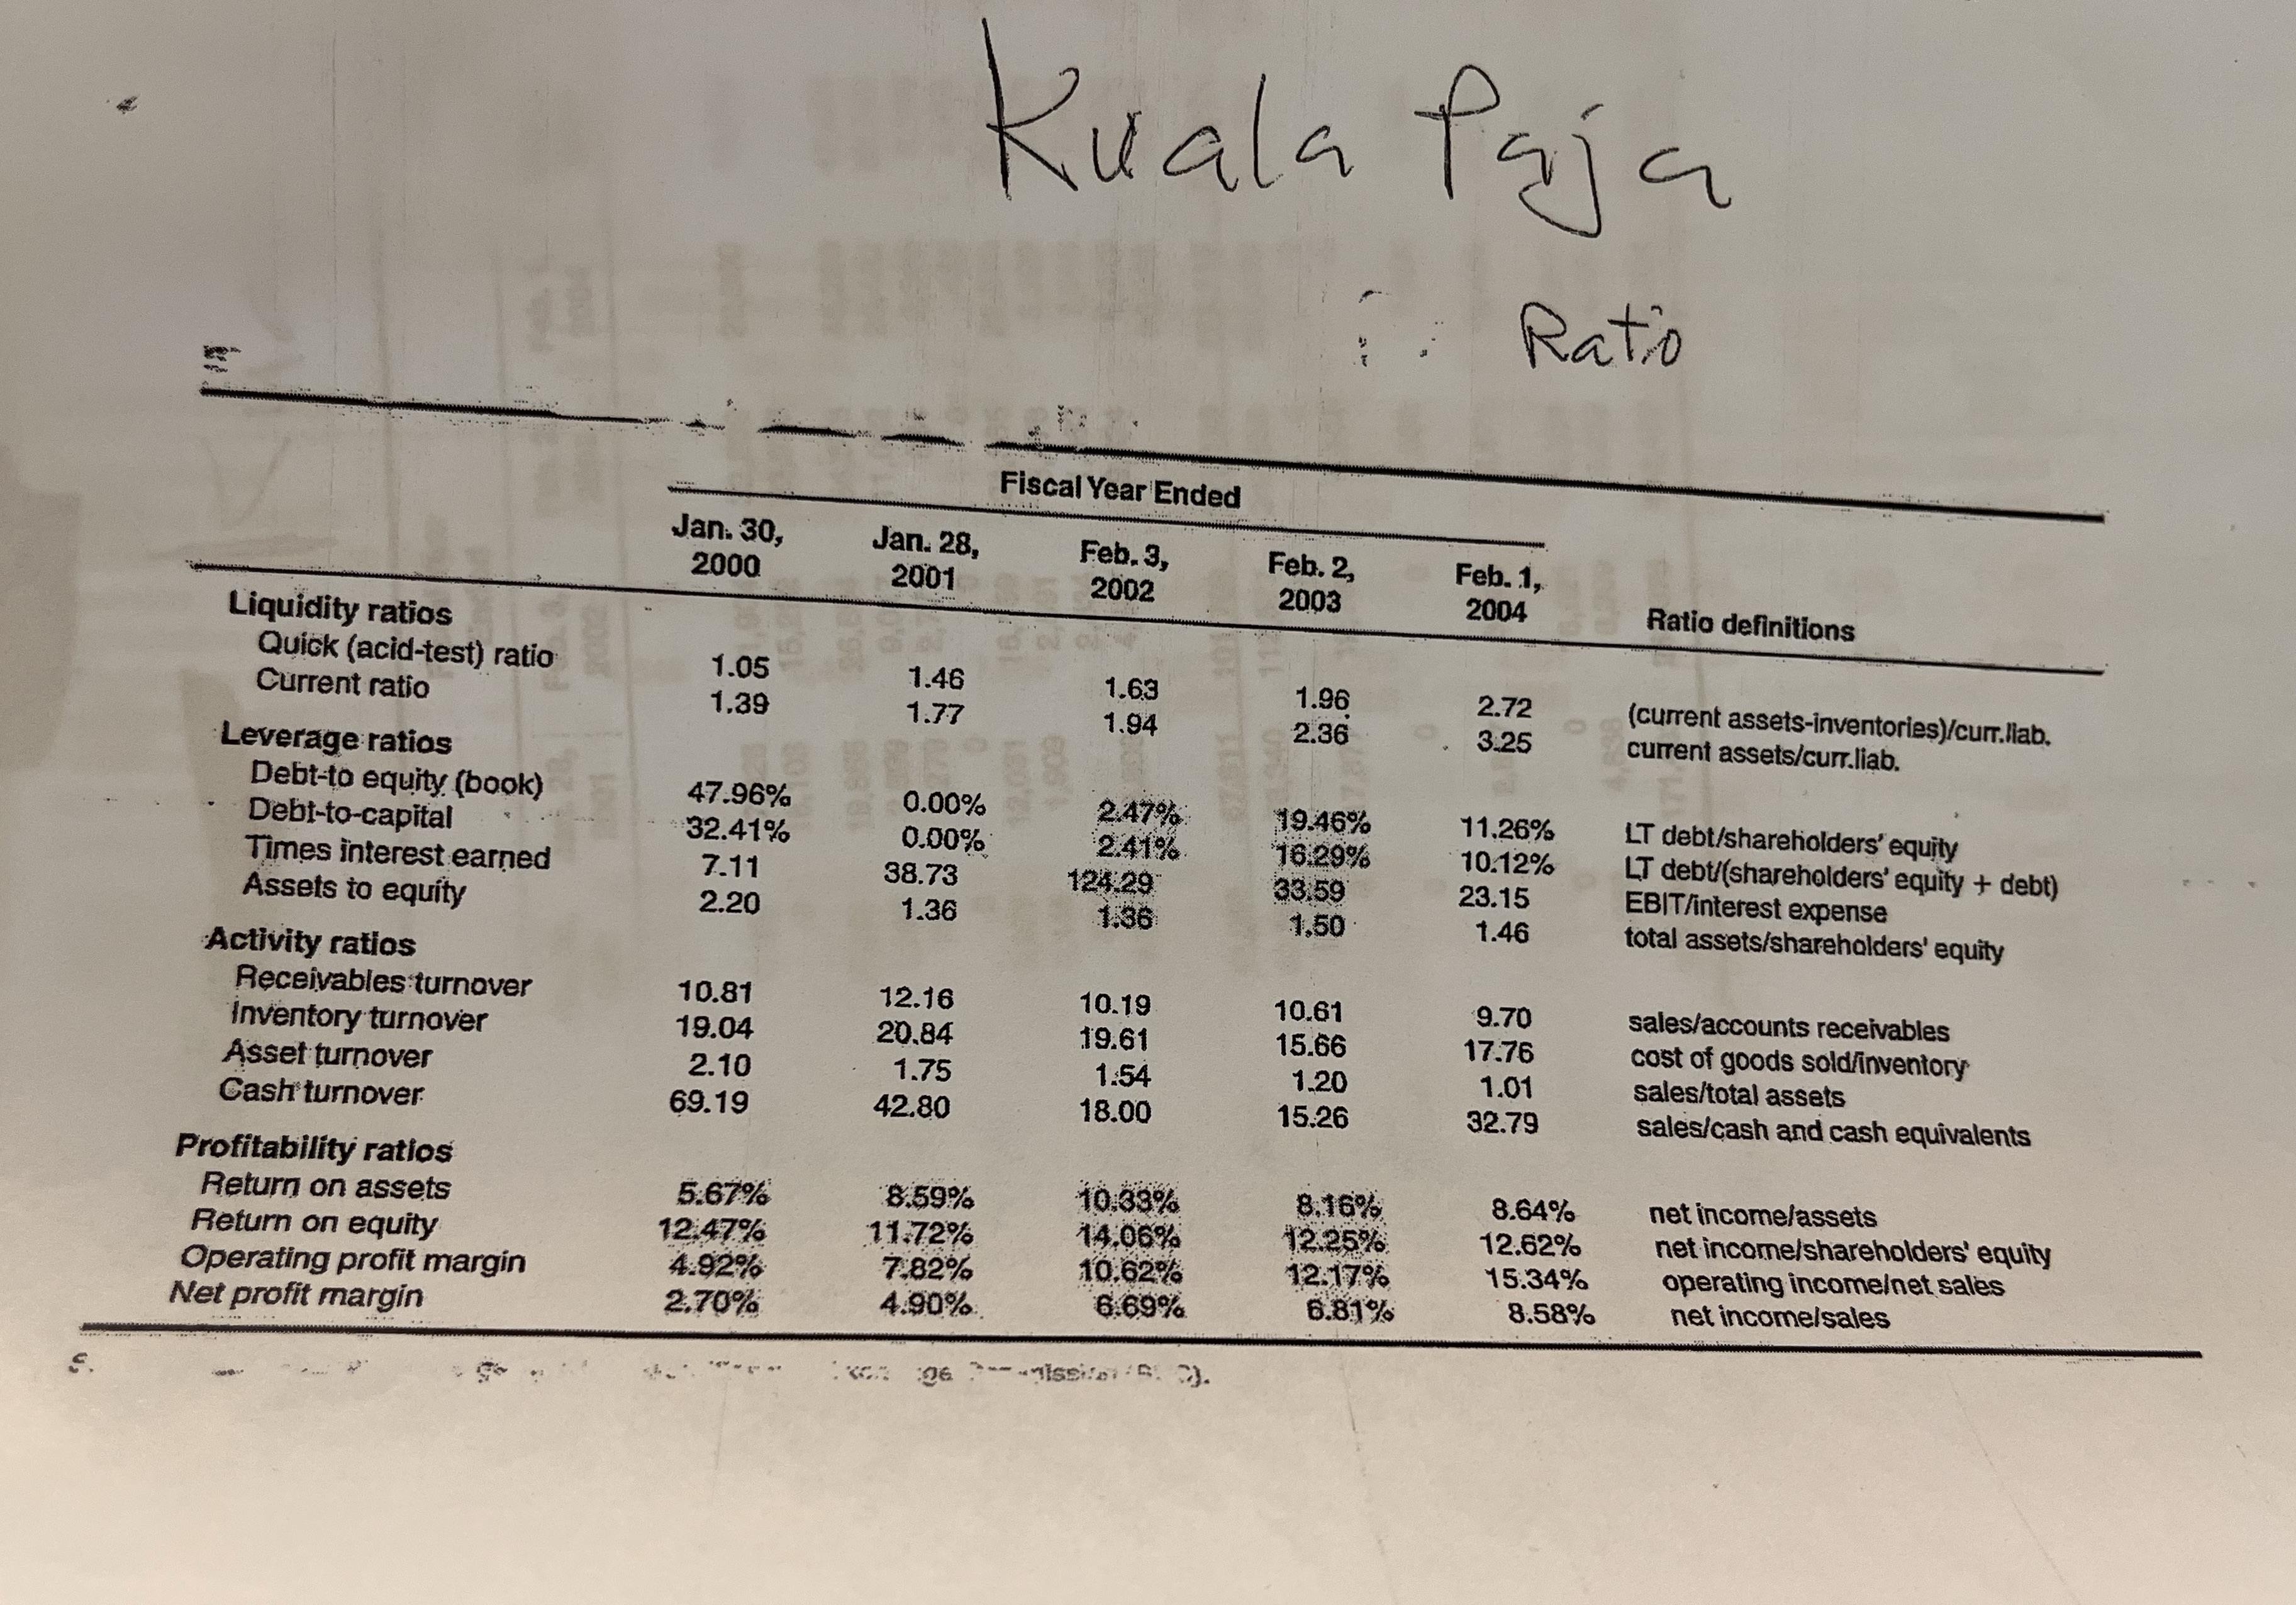
132 art Two Financial Analy Kuala Paja EXHIBIT 2 | Balance Sheets Fiscal Year Three Months Ended Ended Jan. 30, Jan. 28, Feb. 3, Feb. 2, Feb. 1, May 2 (in thousands) Aug. 1, 2000 2001 2002 2003 2004 2004 2004 ASSETS Current Assets: Cash and cash equivalents 3,183 7,026 21,904 32,203 20,300 13,715 19,309 Short-term investments 18,103 15,292 22,976 Accounts receivable 17,965 19,855 26,894 34,373 45,283 47,434 44,329 Accounts receivable, affiliates 1,608 2,599 9,017 11,062 20,482 20,740 19,933 Other receivables 794 2,279 2,771 884 2,363 3,169 4,868 Notes receivable, affiliates 458 4,404 5,440 Inventories 9,979 12,031 16,159 24,365 28,573. 32,974 33,076 Prepaid expenses 3, 148 1,909 2,591 3,478 5,399 4,675 6,749 Income taxes refundable 861 2,534 1,963 7,946 : 7,449 8,139 Deferred income taxes 3,500 3,809 4,607 9,824 6,453 13,280 20,005 Assets held for sale 36,856 3,374 3,325 Total current assets 41.038 67.611 101,769 141.128 174,113 151.214 165,173 Property and equipment, net 60,584 78,340 112,577 202,558 281,103 301,160 297,154 Deferred income taxes 1,398 Long-term investments 17,877 12,700 4,344 0 Long-term notes receivable, affiliates 0 0 0 1,000 7,609 2,988 2,925 Investments in unconsolidated joint ventures 2,827 3,400 6,871 12,426 10,728 9,921 Reacquired franchise rights, goodwill, other intangibles 0 0 16,621 49,354 175,957 176,078 176,045 Other assets 1,938 4,838 8,309 5,232 9,456 12,315 10,390 Total assets 104,958 171,493 255,376 410,487 660,664 654,483 661,608Jan. 30, Jan. 28, Feb. 3, Feb. 2, Feb. 1, May 5, May 2, Aug. 3, Aug. 1, Income Statement 2000 2001 2002 2003 2004 2003 2004 2003 2004 Total revenues 220,243 300,715 * 394,354 491,549 665,592 148,660 184,356 159,178 177,448 Operating expenses 190,003 250,690 316.946 381,489 507,396 112,480 141,383 120,573 145,633 General and administrative expenses 14,856 20,061 27,562 28,897 36,912 8,902 10.664 9,060 11,845 Depreciation and amortization expenses 4,546 6,457 7,959 12.271 19,723 4,101 6,130 4.536 6,328 Arbitration award 9.075 . (525) (525) Provision for restructuring Impairment charges and closing costs 7,543 1,802 Income from operations 10.838 23.507 41,887 59,817 102,086 23.702 18,636 25.607 11,840 Interest Income 293 2.325 2.980 1.968 921 227 175 206 226 Interest expense (1,525) (607) (337 (1,781) (4,409) (864) (1,433) (007) (1,966) Equity loss in joint ventures (706) (602) (2,008) (1,836) (80 4) ($75) (802) (303) Minority Interest 716) (1,147) (2.287) (2072) (616) (126 (616) 257 Other expense, net (20) (235) (234) (13) (25) (156) (345) 114 Income before income taxes 9.808 23 783 42 548 54 713 84.677 21,728 16.522 22,454% 10,692 Provision for Income taxes 3.650 9.058 16,168 21 295 37,590 8.589 6.675 9,014 4.438 Discontinued operations" 34,285 $430 430 Net income 5.953 14 725 26.378 33,478 57,087 13,140 (24/435) 13,001 5,764 Diluted samings per share 0.15 0.27 0.45 0.56 0.82 0.22 (0.38) 0.21 0.09 Share price (fiscal year close) 16.22 39.85 30.41 36.64 Number of shares outstanding (millions) 29.7 545 50.8 82.1 60 7 83.6 82.1 83A Resulting from divestiture of Mortame Mills.Kuala Paja : : Ratio Fiscal Year Ended Jan. 30, Jan. 28, Feb. 3, 2000 Feb. 2, 2001 Feb. 1, 2002 2003 2004 Ratio definitions Liquidity ratios Quick (acid-test) ratio 1.05 1.46 Current ratio 1.6.3 1.96 2.72 1.39 1.77 (current assets-inventories)/curr.llab. 1.94 2.36 3.25 current assets/curr.liab. Leverage ratios Debt-to equity (book) 47.96% 0.00% 2:47% 19.46% 11.26% Debt-to-capital 32.41% LT debt/shareholders' equity 0.00% 2:41% 16.29% 10.12% LT debt/(shareholders' equity + debt) Times interest earned 7.11 38.73 124.29 33.59 23.15 EBIT/interest expense Assets to equity 2.20 1.36 1.36 1.50 1.46 total assets/shareholders' equity Activity ratios Receivables turnover 10.81 12.16 10.19 10.61 9.70 sales/accounts receivables Inventory turnover 19.04 20.84 19.61 15.66 17.76 cost of goods sold/inventory Asset turnover 2.10 1.75 1:54 1.20 1.01 sales/total assets Cash turnover 69.19 42.80 18.00 15.26 32.79 sales/cash and cash equivalents Profitability ratios Return on assets 5:67% 8.59% 10.38% 8.16% 8.64% net income/assets Return on equity 12:47% 11:72% 14.06% 12.25% 12.62% net income/shareholders' equity 12:17% operating incomeet sales Operating profit margin 4.92% 7.82% 10.62% 15:34% Net profit margin 2.70% 4.90% 6:69% 6.81% 8.58% net income/sales
Step by Step Solution
There are 3 Steps involved in it

Get step-by-step solutions from verified subject matter experts