

Question: Analyse the graph below: As the mentioned-above graph is the result of the calculation of one-year Treasury bill rates and liquidity premiums for the next
Analyse the graph below:
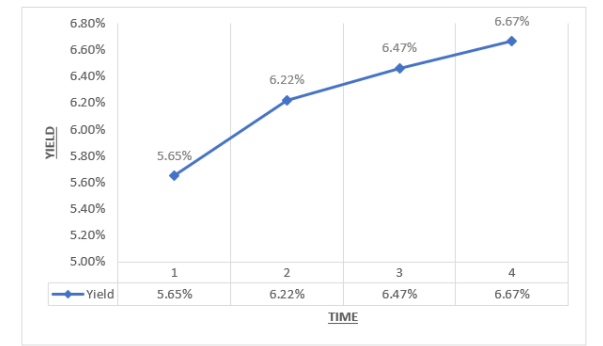
As the mentioned-above graph is the result of the calculation of one-year Treasury bill rates and liquidity premiums for the next four years by using the liquidity premium theory and after plotting the current yield curve. Now, you are required to interpret the result as shown in the graph and illustrate it properly.
YIELD 6.80% 6.60% 6.40% 6.22% 6.47% 6.67% 6.20% 6.00% 5.80% 5.65% 5.60% 5.40% 5.20% 5.00% 1 2 3 4 Yield 5.65% 6.22% 6.47% 6.67% TIME
Step by Step Solution
There are 3 Steps involved in it
1 Expert Approved Answer
Step: 1 Unlock

Question Has Been Solved by an Expert!
Get step-by-step solutions from verified subject matter experts
Step: 2 Unlock
Step: 3 Unlock