

Question: Analysing real life problems Greedy and Dynamic programming algorithms def plotGraph(G, title): # draw options pos = nx.spring_layout(G, seed=0) # positions for all nodes -
Analysing real life problems Greedy and Dynamic programming algorithms
def plotGraph(G, title):
# draw options
pos = nx.spring_layout(G, seed=0) # positions for all nodes - seed for reproducibility
nx.draw_networkx_nodes(G, pos,node_color='#ffffff',edgecolors='#3498db', node_size=1000)
nx.draw_networkx_edges(G, pos, width=2, edge_color='#3498db')
nx.draw_networkx_labels(G, pos, font_size=14,font_family="sans-serif")
edge_labels = nx.get_edge_attributes(G, "weight")
nx.draw_networkx_edge_labels(G, pos, edge_labels)
ax = plt.gca()
ax.margins(0.08)
plt.axis("off")
plt.tight_layout()
plt.title(title,fontsize = 20)
plt.show()
if __name__ == "__main__":
main()
Note :for task 1code and task 2 code you should include each one in a main function so the format of the code should be like this :
def main():
task1 code or task2 code
def plotGraph(G, title):
# draw options
pos = nx.spring_layout(G, seed=0) # positions for all nodes - seed for reproducibility
nx.draw_networkx_nodes(G, pos,node_color='#ffffff',edgecolors='#3498db', node_size=1000)
nx.draw_networkx_edges(G, pos, width=2, edge_color='#3498db')
nx.draw_networkx_labels(G, pos, font_size=14,font_family="sans-serif")
edge_labels = nx.get_edge_attributes(G, "weight")
nx.draw_networkx_edge_labels(G, pos, edge_labels)
ax = plt.gca()
ax.margins(0.08)
plt.axis("off")
plt.tight_layout()
plt.title(title,fontsize = 20)
plt.show()
if __name__ == "__main__":
main()
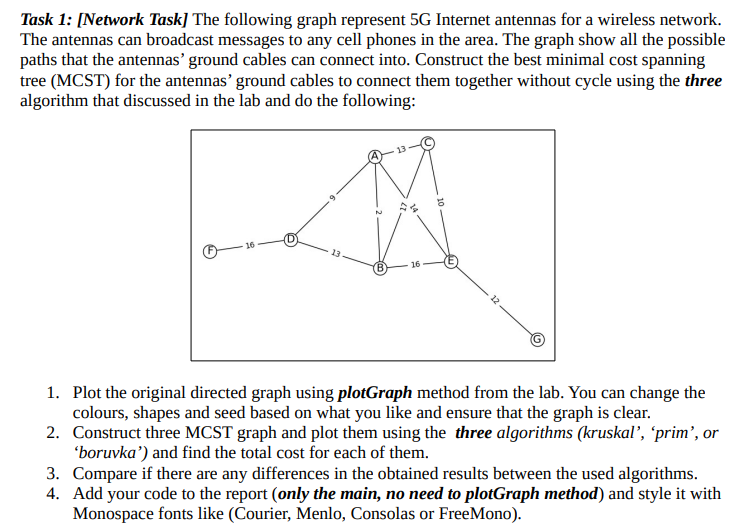
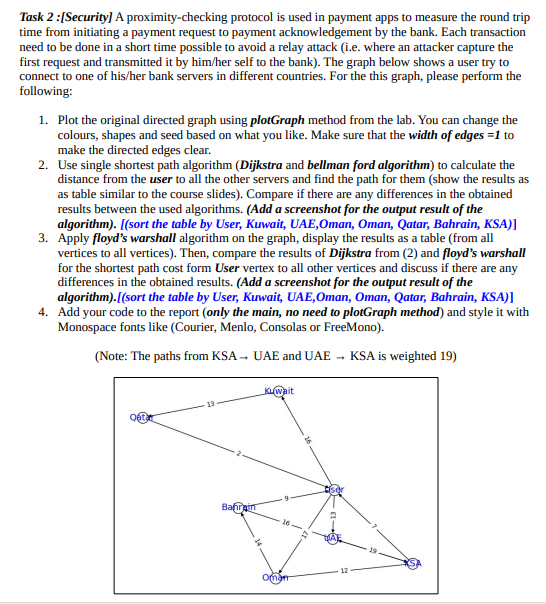
Task 1: [Network Task] The following graph represent 5G Internet antennas for a wireless network. The antennas can broadcast messages to any cell phones in the area. The graph show all the possible paths that the antennas' ground cables can connect into. Construct the best minimal cost spanning tree (MCST) for the antennas' ground cables to connect them together without cycle using the three algorithm that discussed in the lab and do the following: 1. Plot the original directed graph using plotGraph method from the lab. You can change the colours, shapes and seed based on what you like and ensure that the graph is clear. 2. Construct three MCST graph and plot them using the three algorithms (kruskal', 'prim', or 'boruvka') and find the total cost for each of them. 3. Compare if there are any differences in the obtained results between the used algorithms. 4. Add your code to the report (only the main, no need to plotGraph method) and style it with Monospace fonts like (Courier, Menlo, Consolas or FreeMono). Task 2 :[Security] A proximity-checking protocol is used in payment apps to measure the round trip time from initiating a payment request to payment acknowledgement by the bank. Each transaction need to be done in a short time possible to avoid a relay attack (i.e. where an attacker capture the first request and transmitted it by him/her self to the bank). The graph below shows a user try to connect to one of his/her bank servers in different countries. For the this graph, please perform the following: 1. Plot the original directed graph using plotGraph method from the lab. You can change the colours, shapes and seed based on what you like. Make sure that the width of edges =1 to make the directed edges clear. 2. Use single shortest path algorithm (Dijkstra and bellman ford algorithm) to calculate the distance from the user to all the other servers and find the path for them (show the results as as table similar to the course slides). Compare if there are any differences in the obtained results between the used algorithms. (Add a screenshot for the output result of the algorithm). [(sort the table by User, Kuwait, UAE,Oman, Oman, Qatar, Bahrain, KSA)] 3. Apply floyd's warshall algorithm on the graph, display the results as a table (from all vertices to all vertices). Then, compare the results of Dijkstra from (2) and floyd's warshall for the shortest path cost form User vertex to all other vertices and discuss if there are any differences in the obtained results. (Add a screenshot for the output result of the algorithm).[(sort the table by User, Kuwait, UAE,Oman, Oman, Qatar, Bahrain, KSA)] 4. Add your code to the report (only the main, no need to plotGraph method) and style it with Monospace fonts like (Courier, Menlo, Consolas or FreeMono)
Step by Step Solution
There are 3 Steps involved in it

Get step-by-step solutions from verified subject matter experts