

Question: please help Homework 2 Analysing real life problems Greedy and Dynamic programming algorithms Pepared by De Abdulla Aldoseri In this Homework, You have two tasks
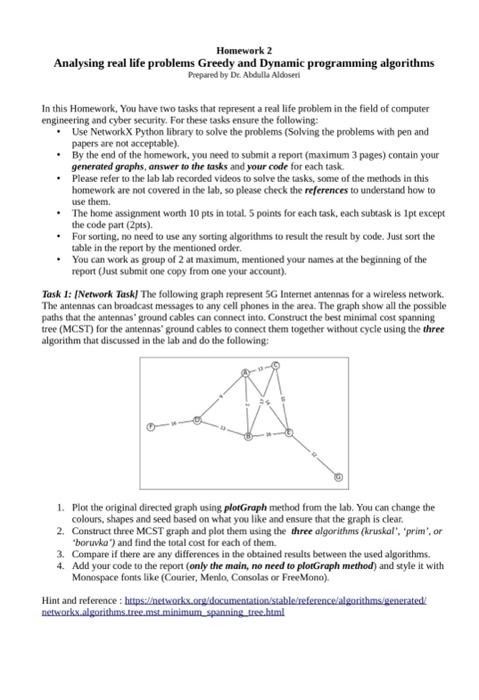
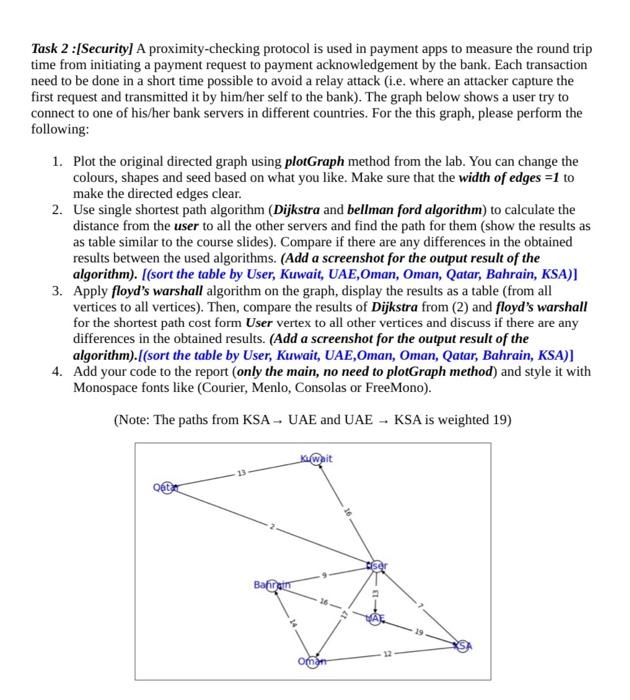
Homework 2 Analysing real life problems Greedy and Dynamic programming algorithms Pepared by De Abdulla Aldoseri In this Homework, You have two tasks that represent a real life problem in the field of computer engineering and cyber security. For these tasks ensure the following: - Use NetworkX Python library to solve the problems (Solving the problems with pen and papers are not acceptable). - By the end of the homework, you need to submit a report (maximum 3 pages) contain your generated grophs, answer to the tasks and your code for each task. - Please refer to the lab lab recorded videos to solve the tasks, some of the methods in this homework are not covered in the lab, so please check the references to understand how to use them. - The bome assignment worth 10 pts in total. 5 points for each task, each subtask is 1 pt except the code part (2pts). - For sorting, no need to use any sorting algorithms to result the result by code. Just sort the table in the report by the mentioned order. - You can work as group of 2 at maximum, mentioned your names at the beginning of the report (Juss submit one copy from one your account). Task 1: [Network Task] The following graph represent 5G Intemet antennas for a wireless network. The antennas can broadcast messages to any cell phones in the ares. The graph show all the possible paths that the antennas' ground cables can connect into. Construct the best minimal cost spanaing tree (MCST) for the antennas' ground cables to connect them together without cycle using the three algorithm that discussed in the lab and do the following: 1. Plot the original directed graph using plotGraph method from the lab. You can change the colours, shapes and seed based on what you like and easure that the graph is clear. 2. Construct three MCST graph and plot them using the three algorithms (kruskal', 'prim', or "boruvka") and find the total cost for each of them. 3. Compare if there are any differences in the obtained resules between the used algorithms. 4. Add your code to the report (only the main, no need to plotGraph method) and style it with Monospace fonts like (Courier, Menlo, Consolas or FreeMono). Hint and reference : https/inetworkx_org/documentation/stable/reference/algorithms/generated networkx,algorithms.tree mst_minimum_spanning tree.heml Task 2 :[Security] A proximity-checking protocol is used in payment apps to measure the round trip time from initiating a payment request to payment acknowledgement by the bank. Each transaction need to be done in a short time possible to avoid a relay attack (i.e. where an attacker capture the first request and transmitted it by him/her self to the bank). The graph below shows a user try to connect to one of his/her bank servers in different countries. For the this graph, please perform the following: 1. Plot the original directed graph using plotGraph method from the lab. You can change the colours, shapes and seed based on what you like. Make sure that the width of edges =1 to make the directed edges clear. 2. Use single shortest path algorithm (Dijkstra and bellman ford algorithm) to calculate the distance from the user to all the other servers and find the path for them (show the results as as table similar to the course slides). Compare if there are any differences in the obtained results between the used algorithms. (Add a screenshot for the output result of the algorithm). [(sort the table by User, Kuwait, UAE,Oman, Oman, Qatar, Bahrain, KSA)] 3. Apply floyd's warshall algorithm on the graph, display the results as a table (from all vertices to all vertices). Then, compare the results of Dijkstra from (2) and floyd's warshall for the shortest path cost form User vertex to all other vertices and discuss if there are any differences in the obtained results. (Add a screenshot for the output result of the algorithm).[(sort the table by User, Kuwait, UAE,Oman, Oman, Qatar, Bahrain, KSA)] 4. Add your code to the report (only the main, no need to plotGraph method) and style it with Monospace fonts like (Courier, Menlo, Consolas or FreeMono)
Step by Step Solution
There are 3 Steps involved in it

Get step-by-step solutions from verified subject matter experts