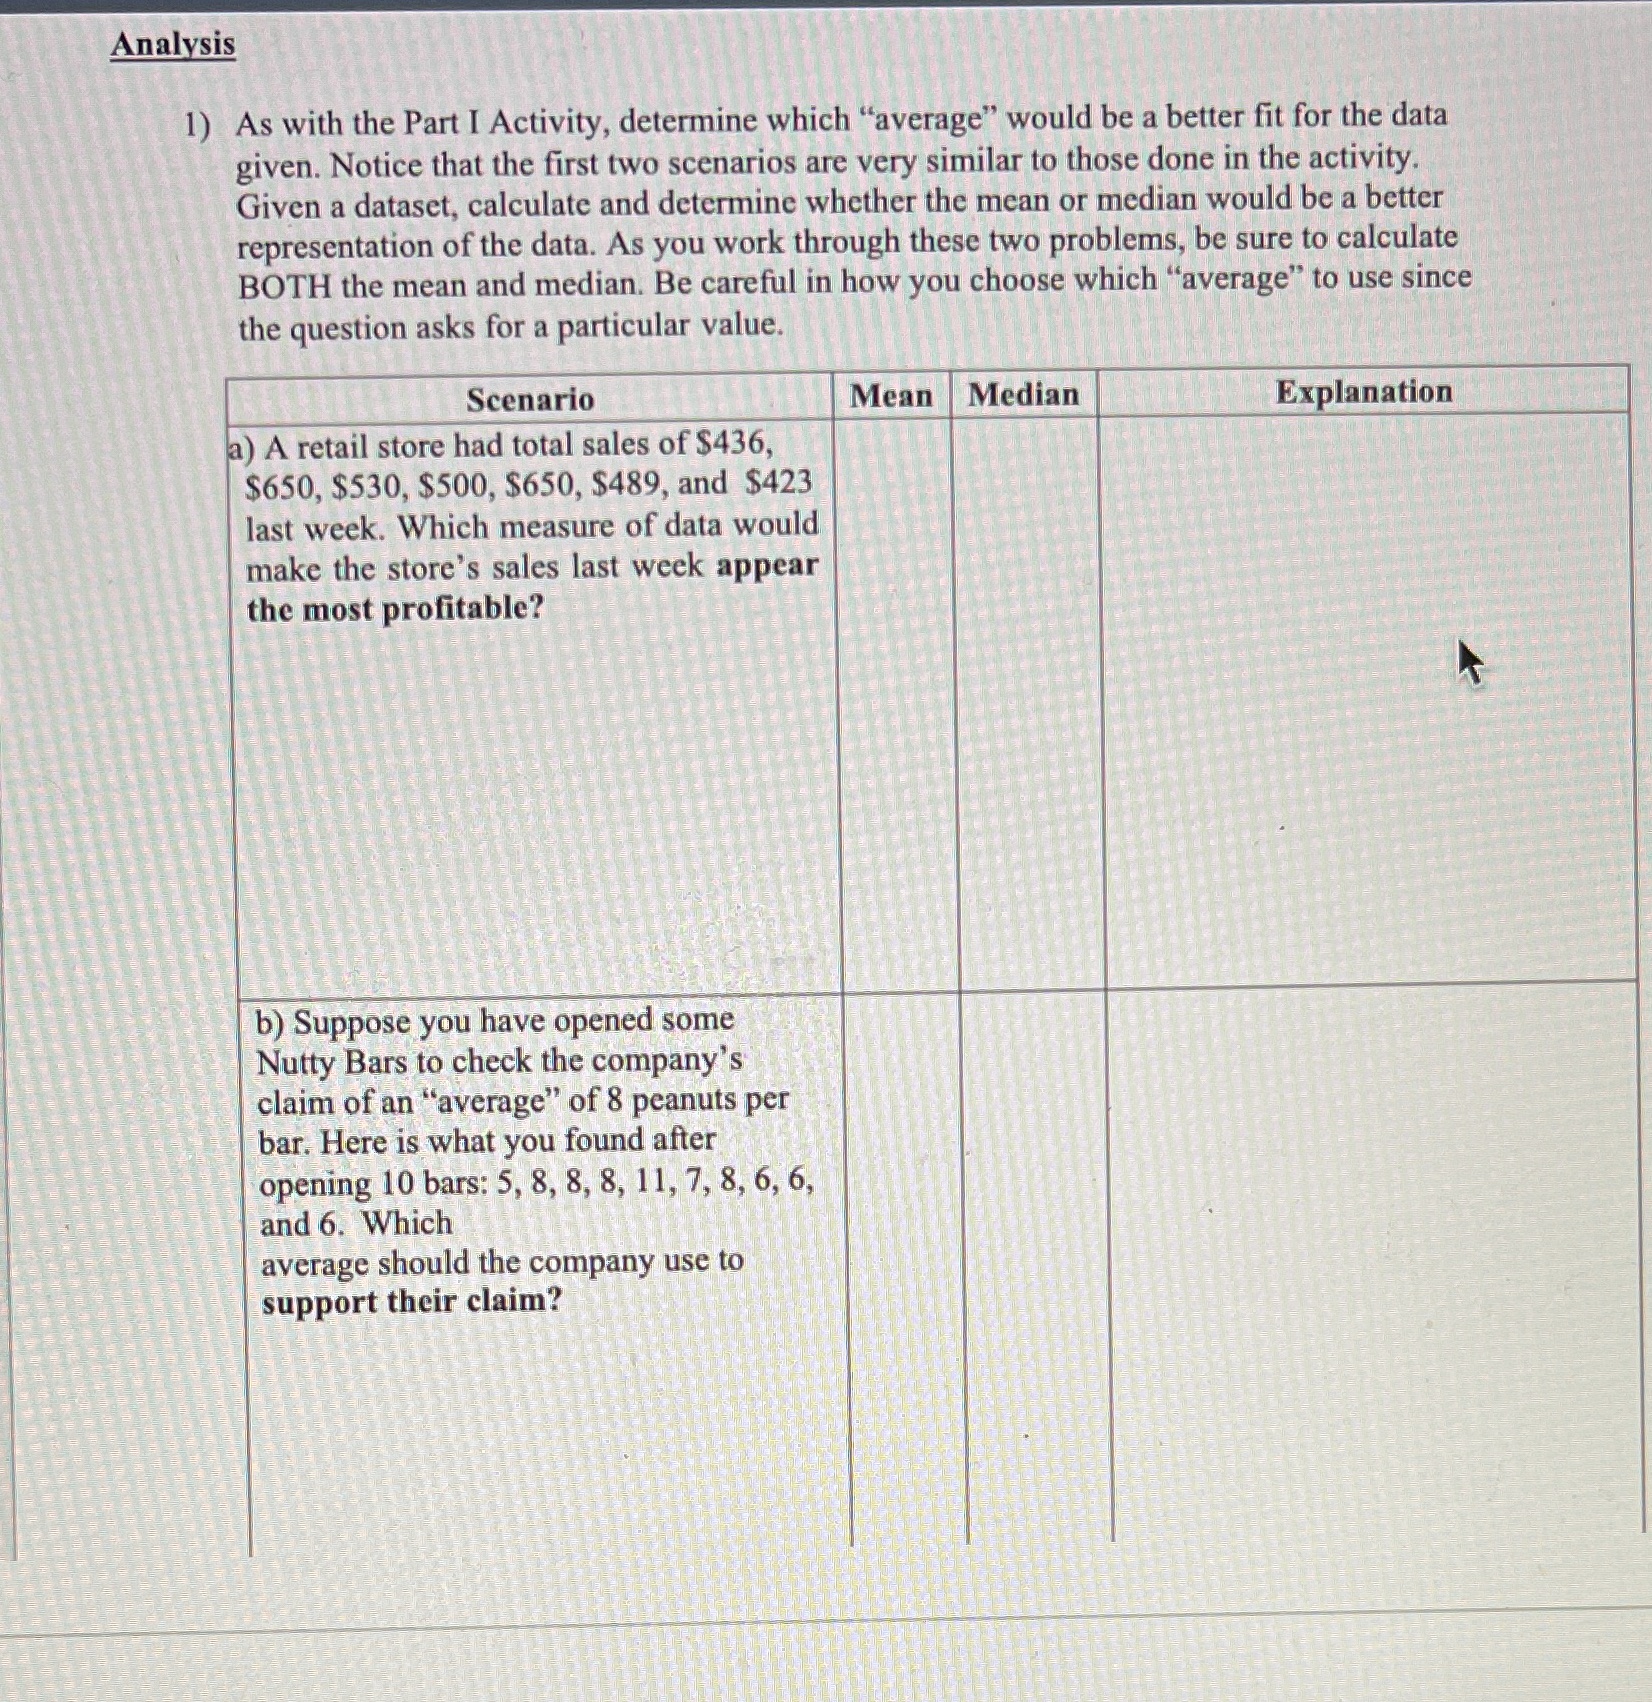
Question: Analysis 1) As with the Part I Activity, determine which average would be a better fit for the data given. Notice that the first two

Analysis 1) As with the Part I Activity,
Analysis 1) As with the Part I Activity, determine which "average" would be a better fit for the data given. Notice that the first two scenarios are very similar to those done in the activity. Given a dataset, calculate and determine whether the mean or median would be a better representation of the data. As you work through these two problems, be sure to calculate BOTH the mean and median. Be careful in how you choose which "average" to use since the question asks for a particular value. Scenario Mean Median Explanation a) A retail store had total sales of $436, $650, $530, $500, $650, $489, and $423 last week. Which measure of data would make the store's sales last week appear the most profitable? b) Suppose you have opened some Nutty Bars to check the company's claim of an "average" of 8 peanuts per bar. Here is what you found after opening 10 bars: 5, 8, 8, 8, 1 1, 7, 8, 6, 6, and 6. Which average should the company use to support their claim

Step by Step Solution

There are 3 Steps involved in it

1 Expert Approved Answer
Step: 1 Unlock blur-text-image
Question Has Been Solved by an Expert!

Get step-by-step solutions from verified subject matter experts

Step: 2 Unlock
Step: 3 Unlock

Students Have Also Explored These Related Mathematics Questions!