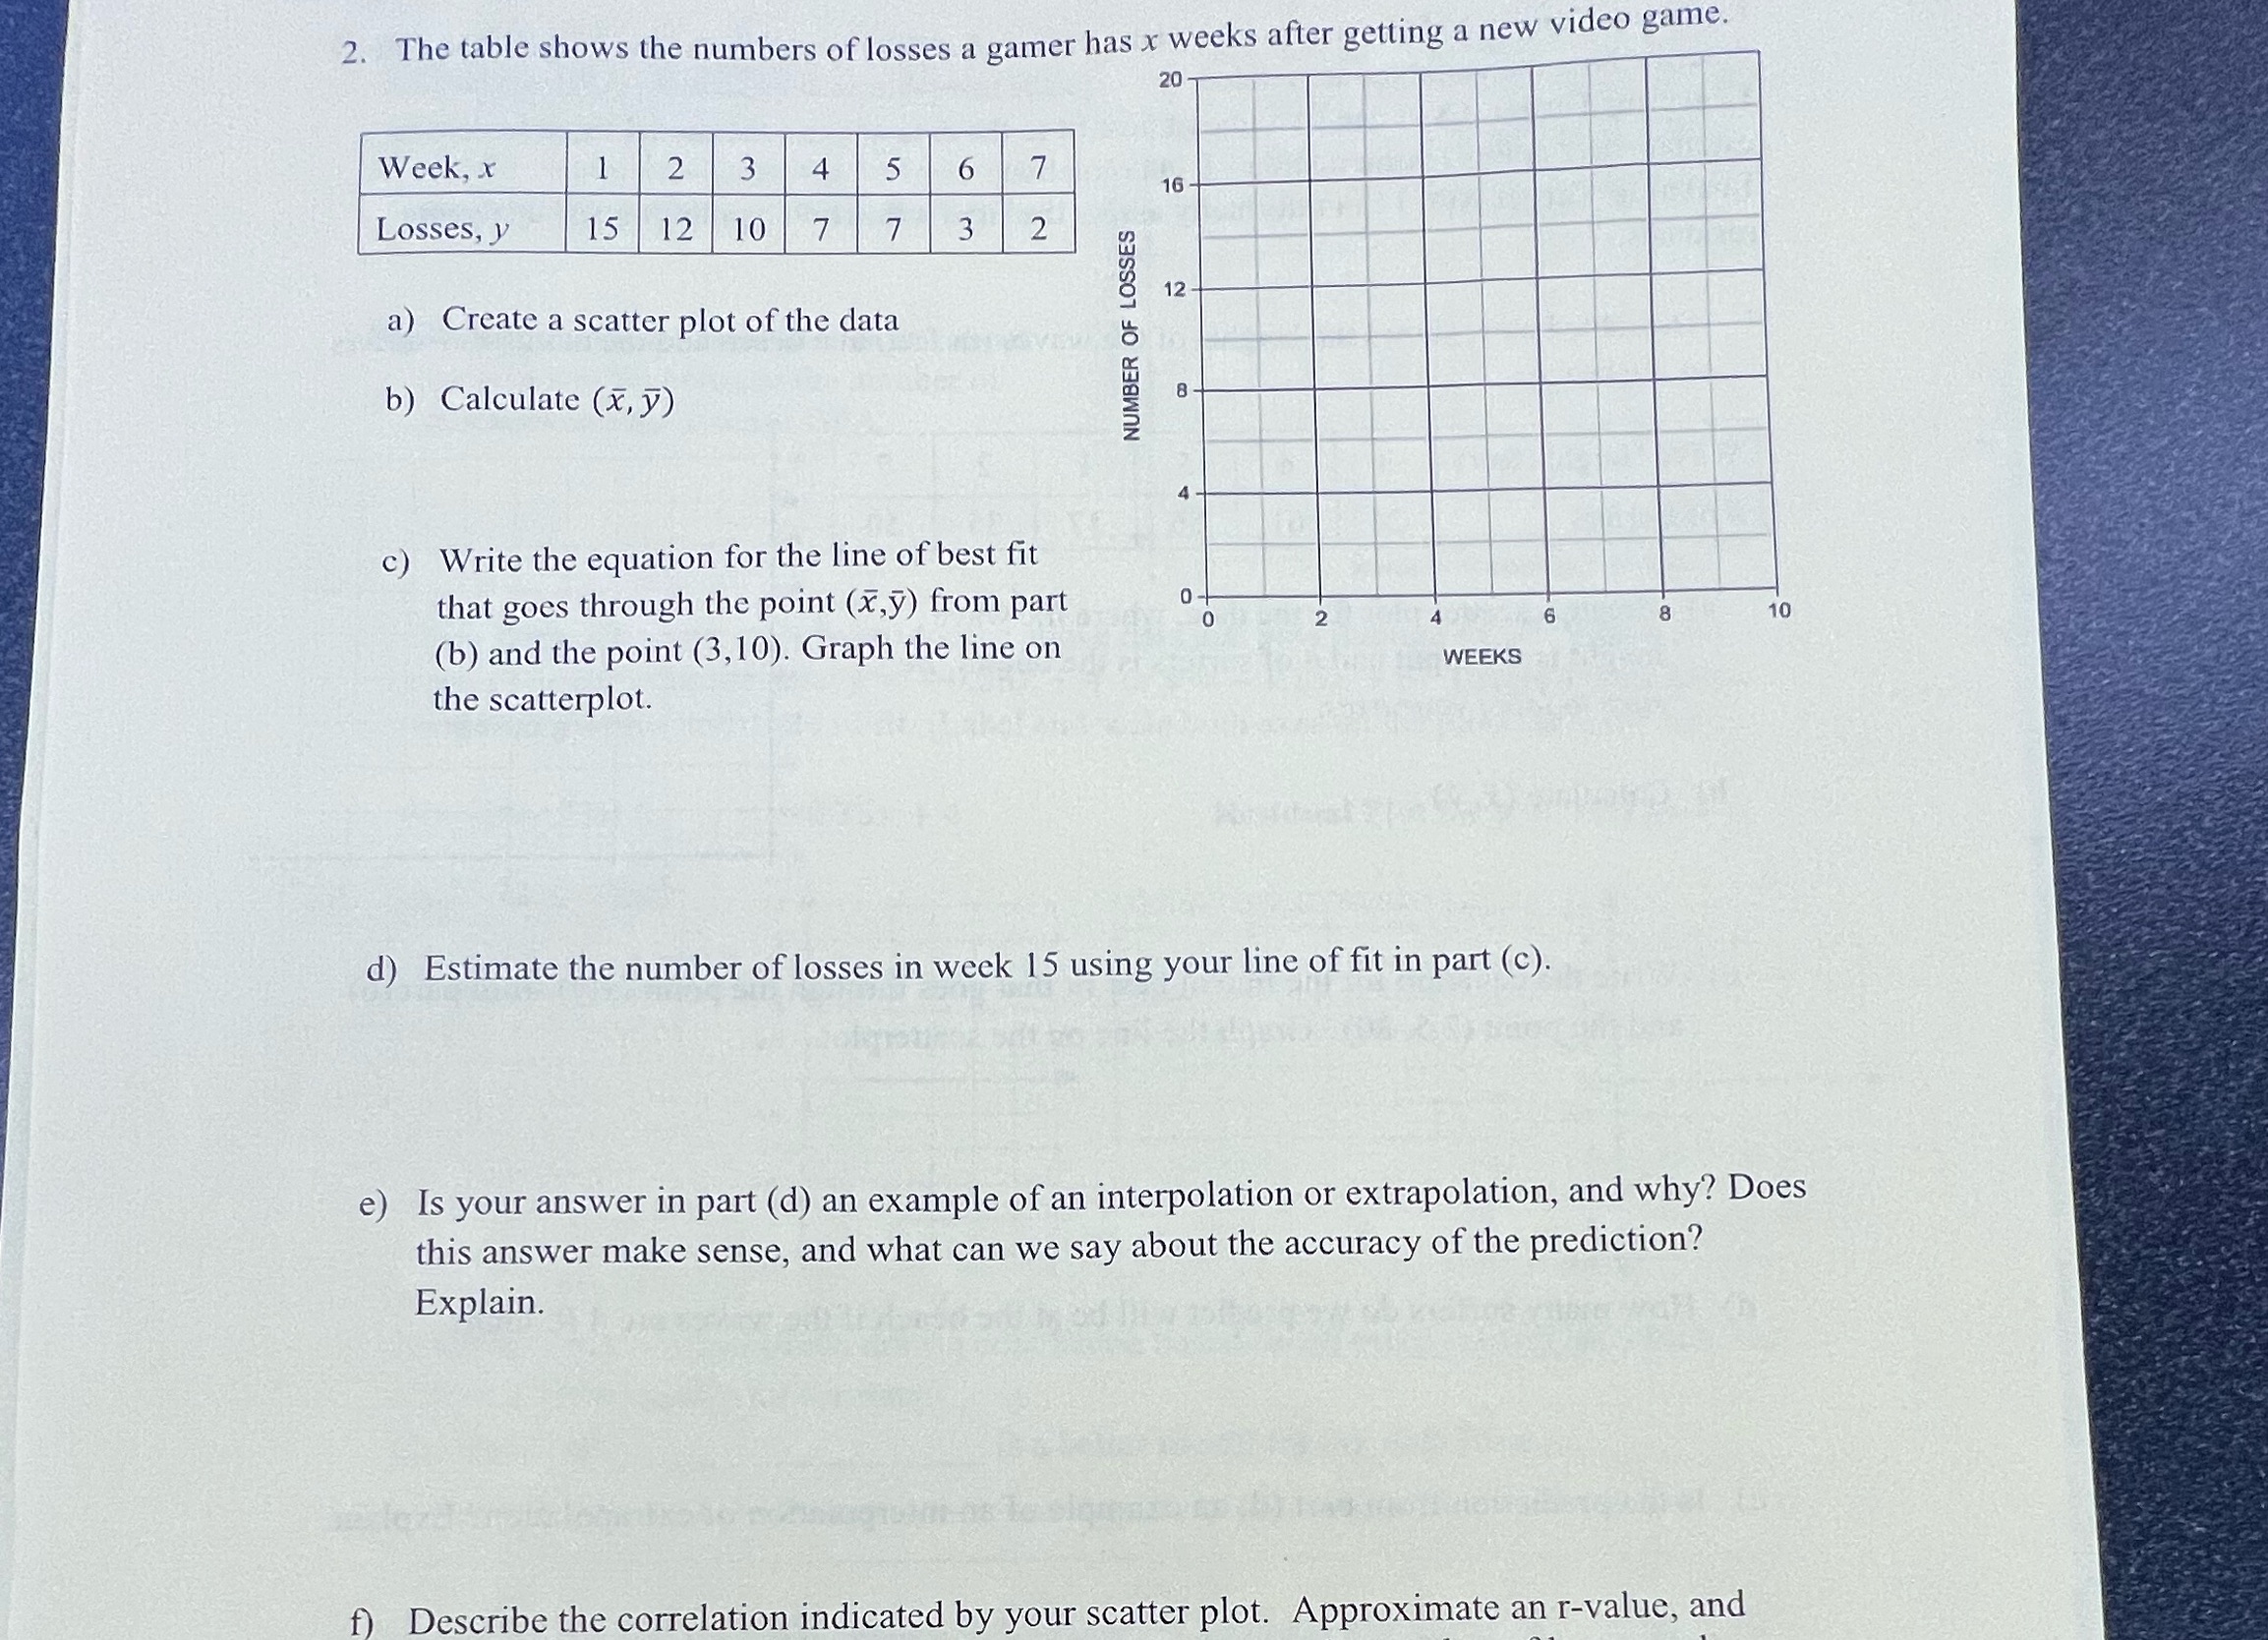
Question: 21) Create a scatter plot of the data b) Calculate (f, 37) NUMBER OF LOSSES c) Write the equation for the line of best t

21) Create a scatter plot of the data b)
21) Create a scatter plot of the data b) Calculate (f, 37) NUMBER OF LOSSES c) Write the equation for the line of best t that goes through the point (56,37) from part (b) and the point (3,10). Graph the line on the scatterplot. d) Estimate the number of losses in week 15 using your line of t in part (c). e) Is your answer in part (d) an example of an interpolation or extrapolation, and why? Does this answer make sense, and what can we say about the accuracy of the prediction? Explain. f) Describe the correlation indicated by your scatter plot. Approximate an r-value, and

Step by Step Solution

There are 3 Steps involved in it

1 Expert Approved Answer
Step: 1 Unlock blur-text-image
Question Has Been Solved by an Expert!

Get step-by-step solutions from verified subject matter experts

Step: 2 Unlock
Step: 3 Unlock

Students Have Also Explored These Related Mathematics Questions!