

Question: Analysis Assignment 1 (AA) offers you the opportunity to demonstrate your understanding of the statistical tools covered in this weeks materials. This Analysis Assignment (AA1)
Analysis Assignment 1 (AA) offers you the opportunity to demonstrate your understanding of the statistical tools covered in this weeks materials. This Analysis Assignment (AA1) requires that you analyze a data set and provide a formal report to Credit Worthy Corp of Nova Scotias executive management team.
AA1 has several components that are often overlooked. You are urged to follow the instructions precisely. Consult them often. The best way to communicate your understanding of the concepts is to use APA formatted headings in your report to management to identify your response to each assignment requirement.
Following the technical analysis, you should change hats from analyst to consultant by providing a formal report to management, communicating information to the client about individual critical information. You should write this report in a way that communicates essential information to the statistically unsophisticated reader. This is where you demonstrate your understanding of the data in laymans terms.
No matter how fancy-schmancy your statistical techniques are, you will still almost always start by simply describing whats therehence, the importance of understanding the simple notion of central tendency (Salkind, 2021, p. 76).
Technical analysis of this data will be accomplished using Excel to calculate measures of central tendency for each variable. Using your knowledge of descriptive statistics, compare and contrast the results of the analysis. Describe the findings using narrative, tables, figures, and charts as needed to communicate useful information effectively.
There are several issues in the data to be discussed. Compare similarities or differences for measures of central tendency for each variable as discussed in the assigned reading. For example, if the median for V3 is different from the mean, what are your observations or conclusions. What caused these differences or similarities? How are they related? What do differences like this tell you about the distribution of values for each of the variables?
Specifically, address the following issues in your report to management in addition to others you identify (do not include these questions in your report to management):
Under what conditions would you use the median rather than the mean as a measure of central tendency?
Using the Credit Analysis Sample data provide an example of at least one situation in which the median might be more valuable than the mean as a measure of central tendency.
Are there any of the five variables for which you would use the mode as the most appropriate measure of central tendency?
Complete this assignment by computing the required statistics. Save your results as an Excel file as defined in Note 1 below. Write the results as a formal report to management as defined below in the instructions. Save this second file as a Word document as defined in Note 2 below. Upload both required files (a Word document and an Excel file) by using the Assignment Link.
The Excel worksheet would not be distributed to management with the written report. Tables, figures, charts, and visual displays used in the report to management executed in Excel must be embedded in the Word document. The Excel worksheet is a supporting document for the management report. The Excel worksheet serves as a show your work supporting document and must be submitted with the Word file.
The management report will broaden the knowledge and effectiveness of senior executives at Credit Worthy Corp of Nova Scotia, assisting in the decision-making process. You should consider that potential readers of the report are generally unsophisticated or uninformed concerning data analysis. As an MBA, you will often be considered a subject matter expert charged with explaining complex issues to those whose expertise is in areas other than yours.
Successful completion of this assignment addresses all issues appropriately and adds value with excellent application of current reading and study material.
Outstanding responses to the assignment use relevant, conceptual, or personal examples directly related to current course topics.
The management report should successfully reflect the theoretical terminology from the current course material and includes thoughtful analysis and active critical-thinking (considering assumptions, analyzing implications, and comparing/contrasting concepts).
The management report should be not less than 500 words, not more than 750 words. Titles, Bible references, quotes, scripture, title page, abstract, references, citations, and reference pages cannot be used to fulfill word count requirements.
Including material from reputable outside sources (outside of the assigned textbooks) is strongly encouraged. APA (7e) in-text citations and references are required.
A Title Page and Abstract are not necessary.
A summative conclusion is recommended.
The management report should be written in third-person voice only. Click here for information on writing in the third-person voice and academic writing.
Excellent grammar, spelling, and APA (7e) formatting are expected in graduate-level work.
Note 1: Save your output in the Excel data file. The required file name standard is, Last Name_First initial_AA1a. Example: TimmonsR_AA1a. xlsx
Note 2: Save your management in a Word file. The required file name standard is, LastNameFirst initial_AA1a. Example: TimmonsR_AA1b. docx
Note 3: Use the Insert Page Number function to include the page number and your name in the header of each page.
Note 4: Both files must be attached at the same time. You cannot upload one file and then go back and try to upload the second file.
Failure to include the Excel worksheet will result in substantial penalties.
Failure to embed tables, figures, charts, and visual displays in the management report will result in substantial penalties.
Failure to comply with Notes 1, 2, 3, or 4 will result in substantial penalties.
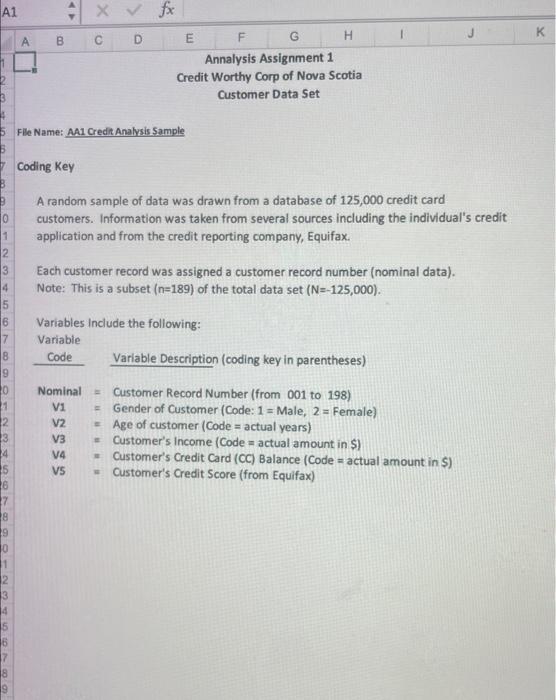
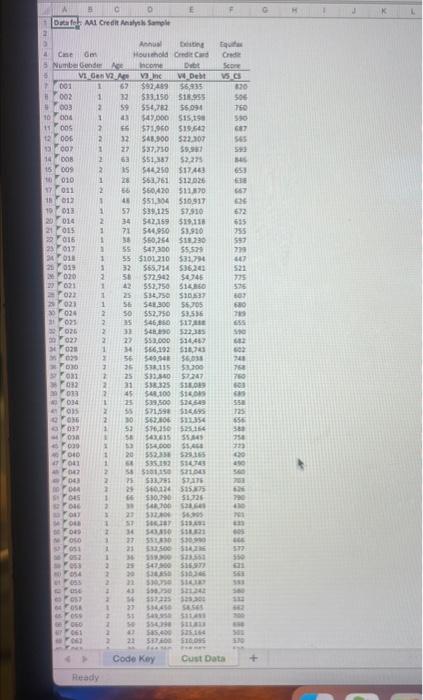
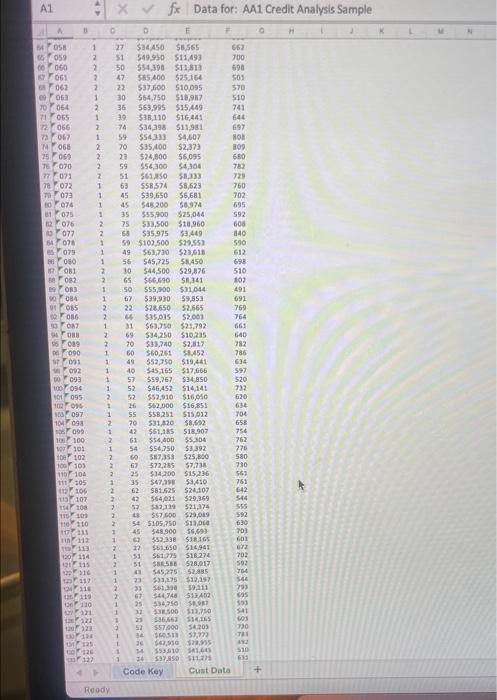
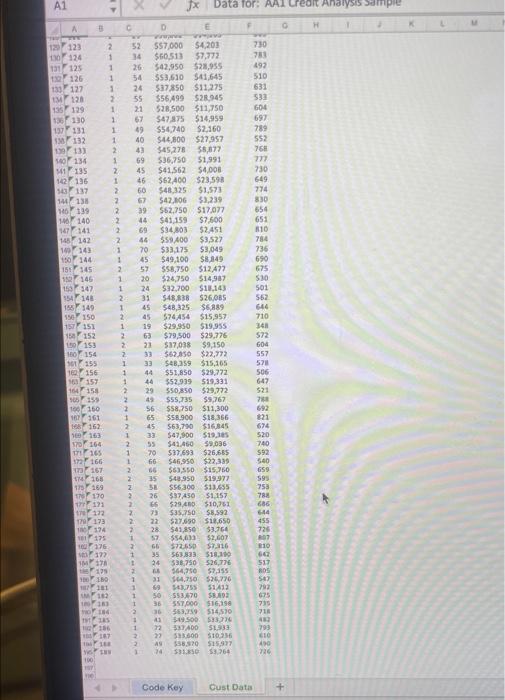
A1 x x K B D E G H F Annalysis Assignment 1 Credit Worthy Corp of Nova Scotia Customer Data Set 5 File Name: AA1 Credit Analysis Sample Coding Key 10 1 A random sample of data was drawn from a database of 125,000 credit card customers. Information was taken from several sources including the individual's credit application and from the credit reporting company, Equifax. Each customer record was assigned a customer record number (nominal data) Note: This is a subset (n=189) of the total data set (N=-125,000). 2 3 4 5 16 Variables include the following: Variable Code Variable Description (coding key in parentheses) 8 9 20 Nominal Vi V2 V3 V4 VS = Customer Record Number (from 001 to 198) Gender of Customer (Code: 1 = Male, 2 = Female) = Age of customer (Code = actual years) Customer's Income (Code = actual amount in $) - Customer's Credit Card (CC) Balance (Code = actual amount in $) Customer's Credit Score (from Equifax) 13 14 $ 26 7 8 4 18 1 Dato Al Credit Analysis Sample Crede Scom V50 200 ECO 20 506 750 590 687 565 53 500 CI 14595 ES 653 29 667 Cele de 5 Number V en V 001 1 1 2 004 1 2 1200 2 007 1 14100 2 15.7.009 2 010 1 7 011 2 012 1 19.013 1 20014 2 21. Ons 1 2015 1 2017 1 1 7099 1 7020 2 021 1 023 1 1 024 2 11025 2 026 2 20027 2 020 1 0 12 52 635 355 597 27 An be Household Credit Income Dut Vinc Ve Debt 62 $97.489 56,935 12 $13,150 $18.95 59 $54,762 $5.090 a $47.000 515,190 55 $75.000 519.42 32 54,900 522.301 537,750 $51.387 52275 15 544250 $1743 20 563,761 $12026 $60420511170 48 551.104 510 917 52 $39125 57.510 34 S2159 $19,113 564,950 53.910 38 550,254 $18.230 SS $47.300 55,573 555101210 31.794 32 555.714 53624 50 $72.942 $4745 552.750 5146 534.750 510 SE S4300 56.JOS 50 552.750 53.556 54610517 33 SEO52238 22 $51.000 514467 566,192 $100 56 54. S. 26 53.115 $200 25 5224 538 325 SHES 45 $43.100 $14.01 25 $39,500 $25 55 571591 S16 30 562106 - 11354 53 $9.50 51 $43.65 SS. $54.000 SALG 20 552 52.165 SE $35.19 S10 521 775 575 303 60 120 SE DU PE 09 GO ONES 793 765 2 12 LE 031 032 03 034 1 SEO AD CH 55 725 556 TO 0 2 2 1 RE UCO 720 030 010 1 1 10 1 1 1 2 2 FLESSIO ser 25 25 EE 043 DO 7045 DIE 9 1 2 $33.55 560274 515 $30,1901 51726 $4.100 520 21 ST 1 2 YE 27 21 1 1 1 1 SOOS 5309 500 23551 54700 Tots tes OS SES CAS LECHES Sots SES THIS 550 ST TES OS 13 24 33 2 53 $500S 552235 23.30 514450 S428511 SS 537SION Stres * 061 SES 106 Code Key CustData Ready A1 ^XA fx Data for: AA1 Credit Analysis Sample 0 0 H 15 05000 069 TON GOH $ CES 569 SE 2 1 590 59 1 OESSES 169 SEOSES 1 TE E 058 1 27 $34450 $8.565 662 6059 2 549.950 $11.493 700 2 50 $54,398 $11.3 061 2 47 585,400 $25.154 501 062 2 22 537.500 $10,095 570 090 1 30 564,750 $18,97 510 70064 2 36 563.995 $15.440 741 71 OR 1 29 $38.110 $16,441 644 72066 2 74 $34,398 $11.981 697 7067 1 59 554333 $4,607 068 2 70 $35.400 $237) 7506 2 23 $24,800 $6,095 680 75 7070 2 59 $54300 54 304 782 77071 2 51 561.50 56.333 729 Te072 1 63 $58,574 58,623 760 073 1 45 $39,650 56,681 702 10 074 1 45 $48.200 $6.974 1075 1 555,900 $25,044 592 2076 2 75 533.500 $10,960 600 077 2 68 $35.975 53.449 840 547078 1 59 $107.500 529,553 079 1 49 $61,730 $23,613 612 080 1 56 545,725 $1.450 698 no 2 30 544,500 529876 510 082 2 $66.690 $1,341 102 ORD 1 50 555,900 $81.044 491 0084 1 67 59,553 085 2 22 $28,650 52.665 769 086 2 $2.001 764 07 1 $63,250 $23,792 960 2 69 $34.250 $10,235 540 2 20 $33,740 52.317 782 1 60 560,261 $8.452 786 09 1 352,950 $19,441 636 092 1 10 545165 517,066 90093 1 57 559,767 $34.850 520 100094 1 52 $46,452 514141 732 101095 2 52 $52,910 $16,950 620 10270 1 H 562.000 $16,851 634 0 097 1 SS 558.251 $15.012 704 104709 2 70 $31.820 $8,692 658 099 1 42 $61,135 $18.907 754 100 100 2 $54.400 55.304 762 100 101 1 54 $54,750 $3.392 275 HD 102 2 587,353 $25,000 580 100 101 2 62 572,205 57,738 730 110 104 2 25 $14,200 $15.236 563 111103 1 $473 53410 761 106 2 $82,625 $24.107 642 3 42 564,021 529.369 544 100 $82,119 521,974 110101 $57.500 $20,019 592 110110 2 54 $105.750 $11,00 630 1011 1 45 $48.900 201 1 112 1 $52.338 GO 12 516941 672 120114 51 $61395 $18.274 20: 10115 51 SSS $28.00 1 502 20116 1 523 1 764 23 117 1 $32.95 140 $12.157 4118 33 67 30 119 S4 695 1 30110 1 3342505 1 3350O512,70 541 23 121 57 $57000 5705 730 1 33 5,272 TH 1125 $9.50 $20.99 126 1 55361051443 510 122 4 597.SO 511 633 Code Key Cunt Date 88055 060 1 H 19 09 SE . ZOLACH CS 555 6295 $1816 ETT 6S 05195 4 345275 SES DICES 58.231 4 COVERS CGS SEVIS 22 SE + Roody H 1 EES 109 1 ( 69 5611 OEZ 1 OOV655 529 1 A1 Jx Data for: AAT Credit Analysis Sample A 3 C E o H 1 w 1123 2 52 557.000 $4,203 730 130 124 1 34 $60,513 57,772 70 131125 1 26 $42,950 $23,955 492 110 126 1 54 353,610 541.645 510 133127 1 24 537350 $11.275 631 M 120 2 55 $56499 $28.945 135129 1 21 $28,500 $11,750 130 130 1 67 $47875 514.959 697 137 131 1 49 $54.740 $2.160 789 15132 1 40 $44,800 $27.957 552 1913) 2 43 $45,278 $8.872 760 500 134 1 536,750 $1,991 227 2 45 $41,562 54.DO 142136 1 46 $62400 $23,59 649 53137 2 60 $48.325 $1,573 774 140138 2 $42.106 $3,239 830 106199 2 39 $62.750 517,077 654 1410140 2 44 $41,159 $7.500 651 147141 2 69 $34,803 52.451 10 1457162 2 66 $3,527 784 10143 1 70 $33.175 $3,049 736 1307144 1 45 $49.100 $8849 690 1517145 2 57 $58,750 $12472 139146 1 20 $24.750 $14,987 530 150167 1 24 $32,700 $11,143 501 354148 2 31 548.838 $26.00 552 155 149 1 45 $48,325 $6,889 644 150 150 2 45 574454 $15,957 710 1577351 1 19 $29,950 $19,955 34 158152 2 63 $79,500 $29.776 572 2 23 $17038 $9,150 604 160154 2 $62350 $22,772 557 SO 155 1 S48,359 $15,165 578 1007156 1 44 $51.850 $29,772 506 163157 1 44 $52.939 519,331 647 164158 2 29 550,850 $29.772 521 905159 2 45 $55,735 $9,767 7 100160 2 56 $58,750 $12,300 692 167161 1 65 $58.900 $18,366 821 162 2 45 563,790516345 17163 1 33 $47,900 $19.95 520 0164 2 55 $41.450 59.036 740 165 1 70 $17.693 $26,655 592 172166 1 $46,950 $22,339 560 3167 2 $53,550 $15.760 165 2 548,950 $19,977 170 169 2 33 $56,300 $13/655 753 170 170 2 26 337450 $1.157 783 19 2 6 529.40 $10,751 686 172 2 73 S8.592 644 2 22 $27.690 $1,650 455 594 2 28 $43,850 $3.764 726 11 1 57 $54,630 $2.00 0176 2 66 572,450 $7.2016 810 172 1 35 563.833518,119 ce M 24 338.750 526,776 ser 512 564,750 575s RDS 180 1 31 1 543.755 51412 792 1 50 553.70 $8.10: 1 36 SAT.00 $16158 739 563.514570 1 $19.500 53.230 16 1 1 22 517100 $1,333 793 2 23 533.600 $10.26 CIO TY 2 $58,570 515,977 490 24 53350 53.264 720 EST001 EE 99 559 565 SE OSESES ELTO 1 VEE GAL Ostosens COS tut 102 SEO 1 ww CES 37 SV Code Key CustData A1 x x K B D E G H F Annalysis Assignment 1 Credit Worthy Corp of Nova Scotia Customer Data Set 5 File Name: AA1 Credit Analysis Sample Coding Key 10 1 A random sample of data was drawn from a database of 125,000 credit card customers. Information was taken from several sources including the individual's credit application and from the credit reporting company, Equifax. Each customer record was assigned a customer record number (nominal data) Note: This is a subset (n=189) of the total data set (N=-125,000). 2 3 4 5 16 Variables include the following: Variable Code Variable Description (coding key in parentheses) 8 9 20 Nominal Vi V2 V3 V4 VS = Customer Record Number (from 001 to 198) Gender of Customer (Code: 1 = Male, 2 = Female) = Age of customer (Code = actual years) Customer's Income (Code = actual amount in $) - Customer's Credit Card (CC) Balance (Code = actual amount in $) Customer's Credit Score (from Equifax) 13 14 $ 26 7 8 4 18 1 Dato Al Credit Analysis Sample Crede Scom V50 200 ECO 20 506 750 590 687 565 53 500 CI 14595 ES 653 29 667 Cele de 5 Number V en V 001 1 1 2 004 1 2 1200 2 007 1 14100 2 15.7.009 2 010 1 7 011 2 012 1 19.013 1 20014 2 21. Ons 1 2015 1 2017 1 1 7099 1 7020 2 021 1 023 1 1 024 2 11025 2 026 2 20027 2 020 1 0 12 52 635 355 597 27 An be Household Credit Income Dut Vinc Ve Debt 62 $97.489 56,935 12 $13,150 $18.95 59 $54,762 $5.090 a $47.000 515,190 55 $75.000 519.42 32 54,900 522.301 537,750 $51.387 52275 15 544250 $1743 20 563,761 $12026 $60420511170 48 551.104 510 917 52 $39125 57.510 34 S2159 $19,113 564,950 53.910 38 550,254 $18.230 SS $47.300 55,573 555101210 31.794 32 555.714 53624 50 $72.942 $4745 552.750 5146 534.750 510 SE S4300 56.JOS 50 552.750 53.556 54610517 33 SEO52238 22 $51.000 514467 566,192 $100 56 54. S. 26 53.115 $200 25 5224 538 325 SHES 45 $43.100 $14.01 25 $39,500 $25 55 571591 S16 30 562106 - 11354 53 $9.50 51 $43.65 SS. $54.000 SALG 20 552 52.165 SE $35.19 S10 521 775 575 303 60 120 SE DU PE 09 GO ONES 793 765 2 12 LE 031 032 03 034 1 SEO AD CH 55 725 556 TO 0 2 2 1 RE UCO 720 030 010 1 1 10 1 1 1 2 2 FLESSIO ser 25 25 EE 043 DO 7045 DIE 9 1 2 $33.55 560274 515 $30,1901 51726 $4.100 520 21 ST 1 2 YE 27 21 1 1 1 1 SOOS 5309 500 23551 54700 Tots tes OS SES CAS LECHES Sots SES THIS 550 ST TES OS 13 24 33 2 53 $500S 552235 23.30 514450 S428511 SS 537SION Stres * 061 SES 106 Code Key CustData Ready A1 ^XA fx Data for: AA1 Credit Analysis Sample 0 0 H 15 05000 069 TON GOH $ CES 569 SE 2 1 590 59 1 OESSES 169 SEOSES 1 TE E 058 1 27 $34450 $8.565 662 6059 2 549.950 $11.493 700 2 50 $54,398 $11.3 061 2 47 585,400 $25.154 501 062 2 22 537.500 $10,095 570 090 1 30 564,750 $18,97 510 70064 2 36 563.995 $15.440 741 71 OR 1 29 $38.110 $16,441 644 72066 2 74 $34,398 $11.981 697 7067 1 59 554333 $4,607 068 2 70 $35.400 $237) 7506 2 23 $24,800 $6,095 680 75 7070 2 59 $54300 54 304 782 77071 2 51 561.50 56.333 729 Te072 1 63 $58,574 58,623 760 073 1 45 $39,650 56,681 702 10 074 1 45 $48.200 $6.974 1075 1 555,900 $25,044 592 2076 2 75 533.500 $10,960 600 077 2 68 $35.975 53.449 840 547078 1 59 $107.500 529,553 079 1 49 $61,730 $23,613 612 080 1 56 545,725 $1.450 698 no 2 30 544,500 529876 510 082 2 $66.690 $1,341 102 ORD 1 50 555,900 $81.044 491 0084 1 67 59,553 085 2 22 $28,650 52.665 769 086 2 $2.001 764 07 1 $63,250 $23,792 960 2 69 $34.250 $10,235 540 2 20 $33,740 52.317 782 1 60 560,261 $8.452 786 09 1 352,950 $19,441 636 092 1 10 545165 517,066 90093 1 57 559,767 $34.850 520 100094 1 52 $46,452 514141 732 101095 2 52 $52,910 $16,950 620 10270 1 H 562.000 $16,851 634 0 097 1 SS 558.251 $15.012 704 104709 2 70 $31.820 $8,692 658 099 1 42 $61,135 $18.907 754 100 100 2 $54.400 55.304 762 100 101 1 54 $54,750 $3.392 275 HD 102 2 587,353 $25,000 580 100 101 2 62 572,205 57,738 730 110 104 2 25 $14,200 $15.236 563 111103 1 $473 53410 761 106 2 $82,625 $24.107 642 3 42 564,021 529.369 544 100 $82,119 521,974 110101 $57.500 $20,019 592 110110 2 54 $105.750 $11,00 630 1011 1 45 $48.900 201 1 112 1 $52.338 GO 12 516941 672 120114 51 $61395 $18.274 20: 10115 51 SSS $28.00 1 502 20116 1 523 1 764 23 117 1 $32.95 140 $12.157 4118 33 67 30 119 S4 695 1 30110 1 3342505 1 3350O512,70 541 23 121 57 $57000 5705 730 1 33 5,272 TH 1125 $9.50 $20.99 126 1 55361051443 510 122 4 597.SO 511 633 Code Key Cunt Date 88055 060 1 H 19 09 SE . ZOLACH CS 555 6295 $1816 ETT 6S 05195 4 345275 SES DICES 58.231 4 COVERS CGS SEVIS 22 SE + Roody H 1 EES 109 1 ( 69 5611 OEZ 1 OOV655 529 1 A1 Jx Data for: AAT Credit Analysis Sample A 3 C E o H 1 w 1123 2 52 557.000 $4,203 730 130 124 1 34 $60,513 57,772 70 131125 1 26 $42,950 $23,955 492 110 126 1 54 353,610 541.645 510 133127 1 24 537350 $11.275 631 M 120 2 55 $56499 $28.945 135129 1 21 $28,500 $11,750 130 130 1 67 $47875 514.959 697 137 131 1 49 $54.740 $2.160 789 15132 1 40 $44,800 $27.957 552 1913) 2 43 $45,278 $8.872 760 500 134 1 536,750 $1,991 227 2 45 $41,562 54.DO 142136 1 46 $62400 $23,59 649 53137 2 60 $48.325 $1,573 774 140138 2 $42.106 $3,239 830 106199 2 39 $62.750 517,077 654 1410140 2 44 $41,159 $7.500 651 147141 2 69 $34,803 52.451 10 1457162 2 66 $3,527 784 10143 1 70 $33.175 $3,049 736 1307144 1 45 $49.100 $8849 690 1517145 2 57 $58,750 $12472 139146 1 20 $24.750 $14,987 530 150167 1 24 $32,700 $11,143 501 354148 2 31 548.838 $26.00 552 155 149 1 45 $48,325 $6,889 644 150 150 2 45 574454 $15,957 710 1577351 1 19 $29,950 $19,955 34 158152 2 63 $79,500 $29.776 572 2 23 $17038 $9,150 604 160154 2 $62350 $22,772 557 SO 155 1 S48,359 $15,165 578 1007156 1 44 $51.850 $29,772 506 163157 1 44 $52.939 519,331 647 164158 2 29 550,850 $29.772 521 905159 2 45 $55,735 $9,767 7 100160 2 56 $58,750 $12,300 692 167161 1 65 $58.900 $18,366 821 162 2 45 563,790516345 17163 1 33 $47,900 $19.95 520 0164 2 55 $41.450 59.036 740 165 1 70 $17.693 $26,655 592 172166 1 $46,950 $22,339 560 3167 2 $53,550 $15.760 165 2 548,950 $19,977 170 169 2 33 $56,300 $13/655 753 170 170 2 26 337450 $1.157 783 19 2 6 529.40 $10,751 686 172 2 73 S8.592 644 2 22 $27.690 $1,650 455 594 2 28 $43,850 $3.764 726 11 1 57 $54,630 $2.00 0176 2 66 572,450 $7.2016 810 172 1 35 563.833518,119 ce M 24 338.750 526,776 ser 512 564,750 575s RDS 180 1 31 1 543.755 51412 792 1 50 553.70 $8.10: 1 36 SAT.00 $16158 739 563.514570 1 $19.500 53.230 16 1 1 22 517100 $1,333 793 2 23 533.600 $10.26 CIO TY 2 $58,570 515,977 490 24 53350 53.264 720 EST001 EE 99 559 565 SE OSESES ELTO 1 VEE GAL Ostosens COS tut 102 SEO 1 ww CES 37 SV Code Key CustData
Step by Step Solution
There are 3 Steps involved in it

Get step-by-step solutions from verified subject matter experts