

Question: Analysis Liquidity Ratio Net Working Capital Formula Total Current Assets - Total Liabilities Assets September 2015 Current ratio Current Assets / Current Liabilities Quick ratio
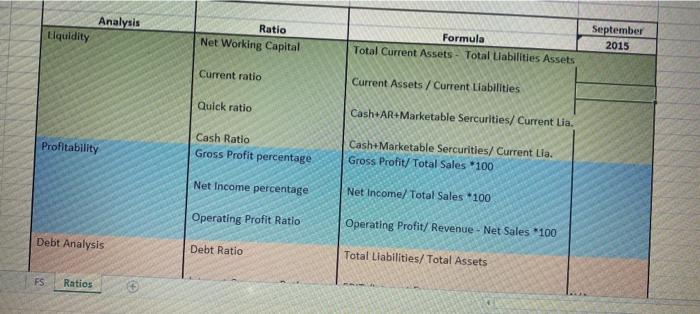
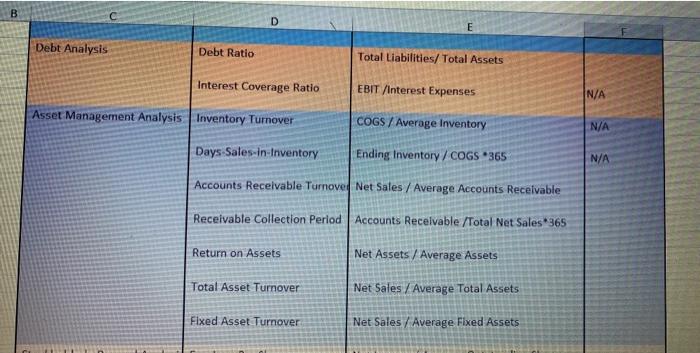
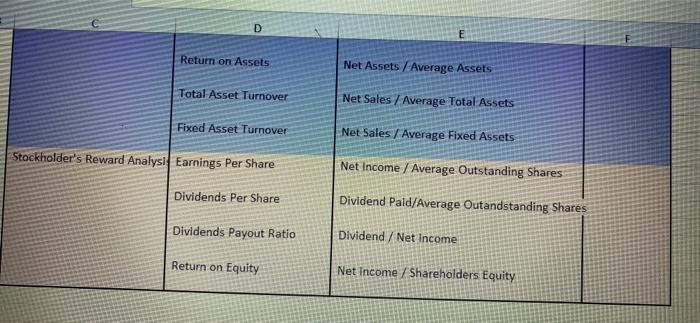
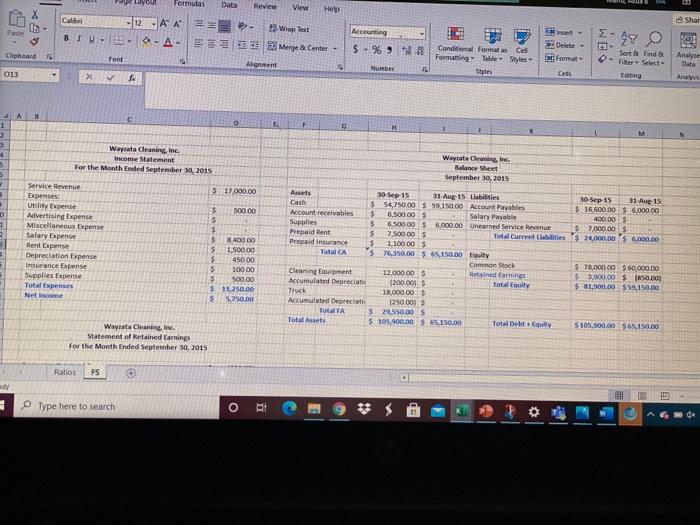
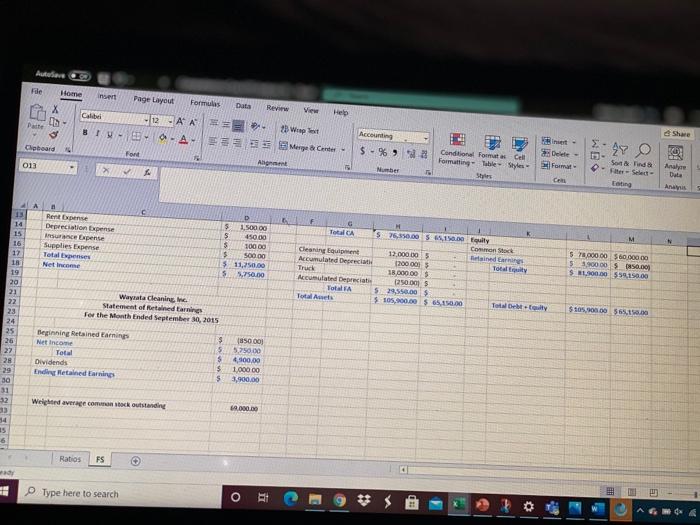
Analysis Liquidity Ratio Net Working Capital Formula Total Current Assets - Total Liabilities Assets September 2015 Current ratio Current Assets / Current Liabilities Quick ratio Cash+AR+Marketable Sercurities/ Current Lia. Profitability Cash Ratio Gross Profit percentage CashMarketable Sercurities/ Current Lla. Gross Profit/Total Sales 100 Net Income percentage Net Income/ Total Sales 100 Operating Profit Ratio Operating Profit/ Revenue - Net Sales *100 Debt Analysis Debt Ratio Total Liabilities/Total Assets FS Ratios D E Debt Analysis Debt Ratio Total Liabilities/Total Assets Interest Coverage Ratio EBIT /Interest Expenses N/A Asset Management Analysis Inventory Turnover COGS / Average Inventory N/A Days-Sales-in-Inventory Ending Inventory / COGS 365 N/A Accounts Receivable Turnover Net Sales / Average Accounts Receivable Receivable Collection Period Accounts Receivable/Total Net Sales* 365 Return on Assets Net Assets / Average Assets Total Asset Turnover Net Sales / Average Total Assets Fixed Asset Turnover Net Sales / Average Fixed Assets D E Return on Assets Net Assets / Average Assets Total Asset Turnover Fixed Asset Turnover Net Sales / Average Total Assets Net Sales / Average Fixed Assets Net Income / Average Outstanding Shares Stockholder's Reward Analysis Earnings Per Share Dividends Per Share Dividend Paid/Average Outandstanding Shares Dividends Payout Ratio Dividend / Net Income Return on Equity Net Income / Shareholders Equity Shar Incert Layout Formulas Data Review View Help Calibri - 12-AA = 23 Wrap Test BTU-O-A- ES Merye & Center Font Alignment X Accounting $ - % * 29 O WS Conditional Formats Cel Formatting Tile Styles Clipboard format Sort & Find a - - Select- ang Analyse Number 013 Cee A B Number Format ce Data Anais Rent Expense Depreciation pense insurance Expense Supplies Expense Total Expenses Net Income M 5 1.500.00 S 450.00 5 10000 $ 500.00 $ 11,750.00 5 1,750.00 f TCA S 25,950.00 50.00 til Common Stock Cleaning Equipment 12.000 305 Accumulated Deprecia 120000! Tot i Truck 18,000.00 Accumulated Deprecat 250.00 Total 529,550.00 $ Total $ 105,900.00 $ 65,150.00 Toby 50000 50000000 590000 500.00 $ 300.00 558.150.00 13 14 15 16 17 18 19 20 21 22 23 24 25 26 22 28 29 30 31 Wayata Cleaning Statement of Retained in For the Month Ended September 4, 2015 $105.000 5.0 Beginning Retained Parnings Net Income Total Dividends Ending detained Earnings 5 $ $ $ 185000) 5.750.000 400.00 1.000.00 3,900,00 Weighted average common sok outstanding 69.000.000 54 15 6 Ratios FS Type here to search O R . 4 0
Step by Step Solution
There are 3 Steps involved in it

Get step-by-step solutions from verified subject matter experts