

Question: Analysis of Variance Table : ob_Prof >F Response :1 Sum Sq Mean Sq F value 0::;0; *** x1 1 1746.67 1746.67 100.4788 3.0 04818 *
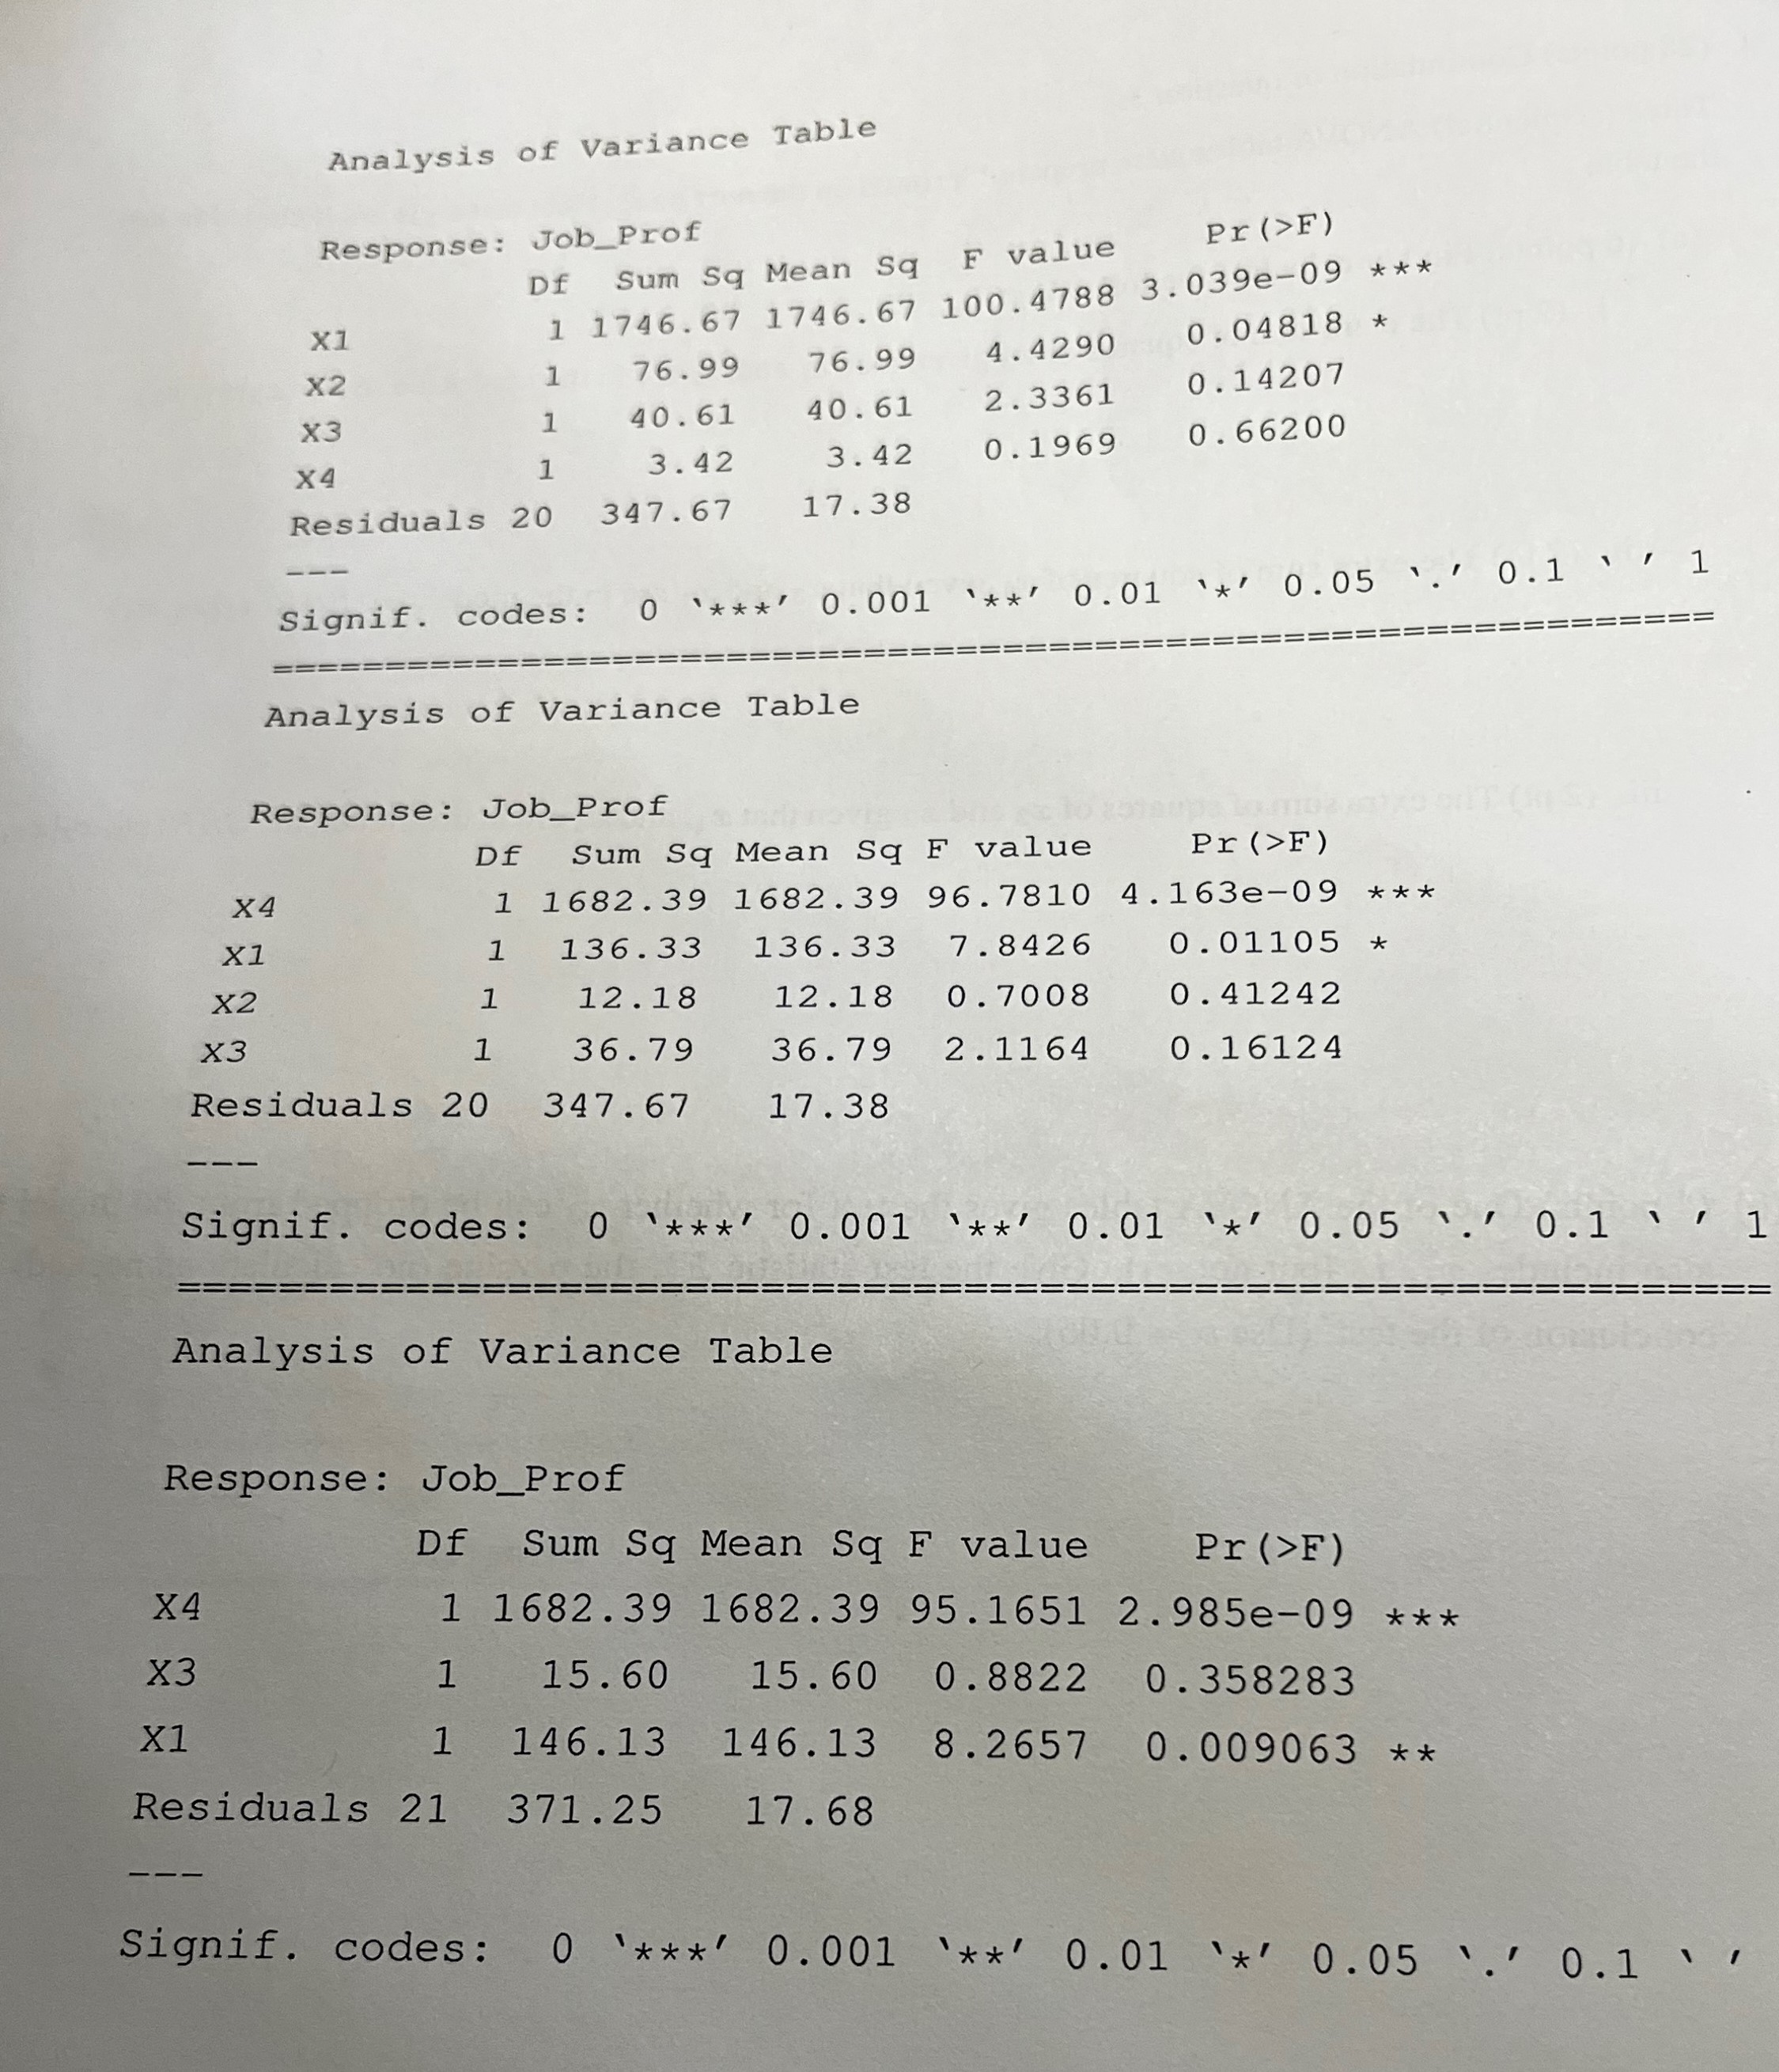
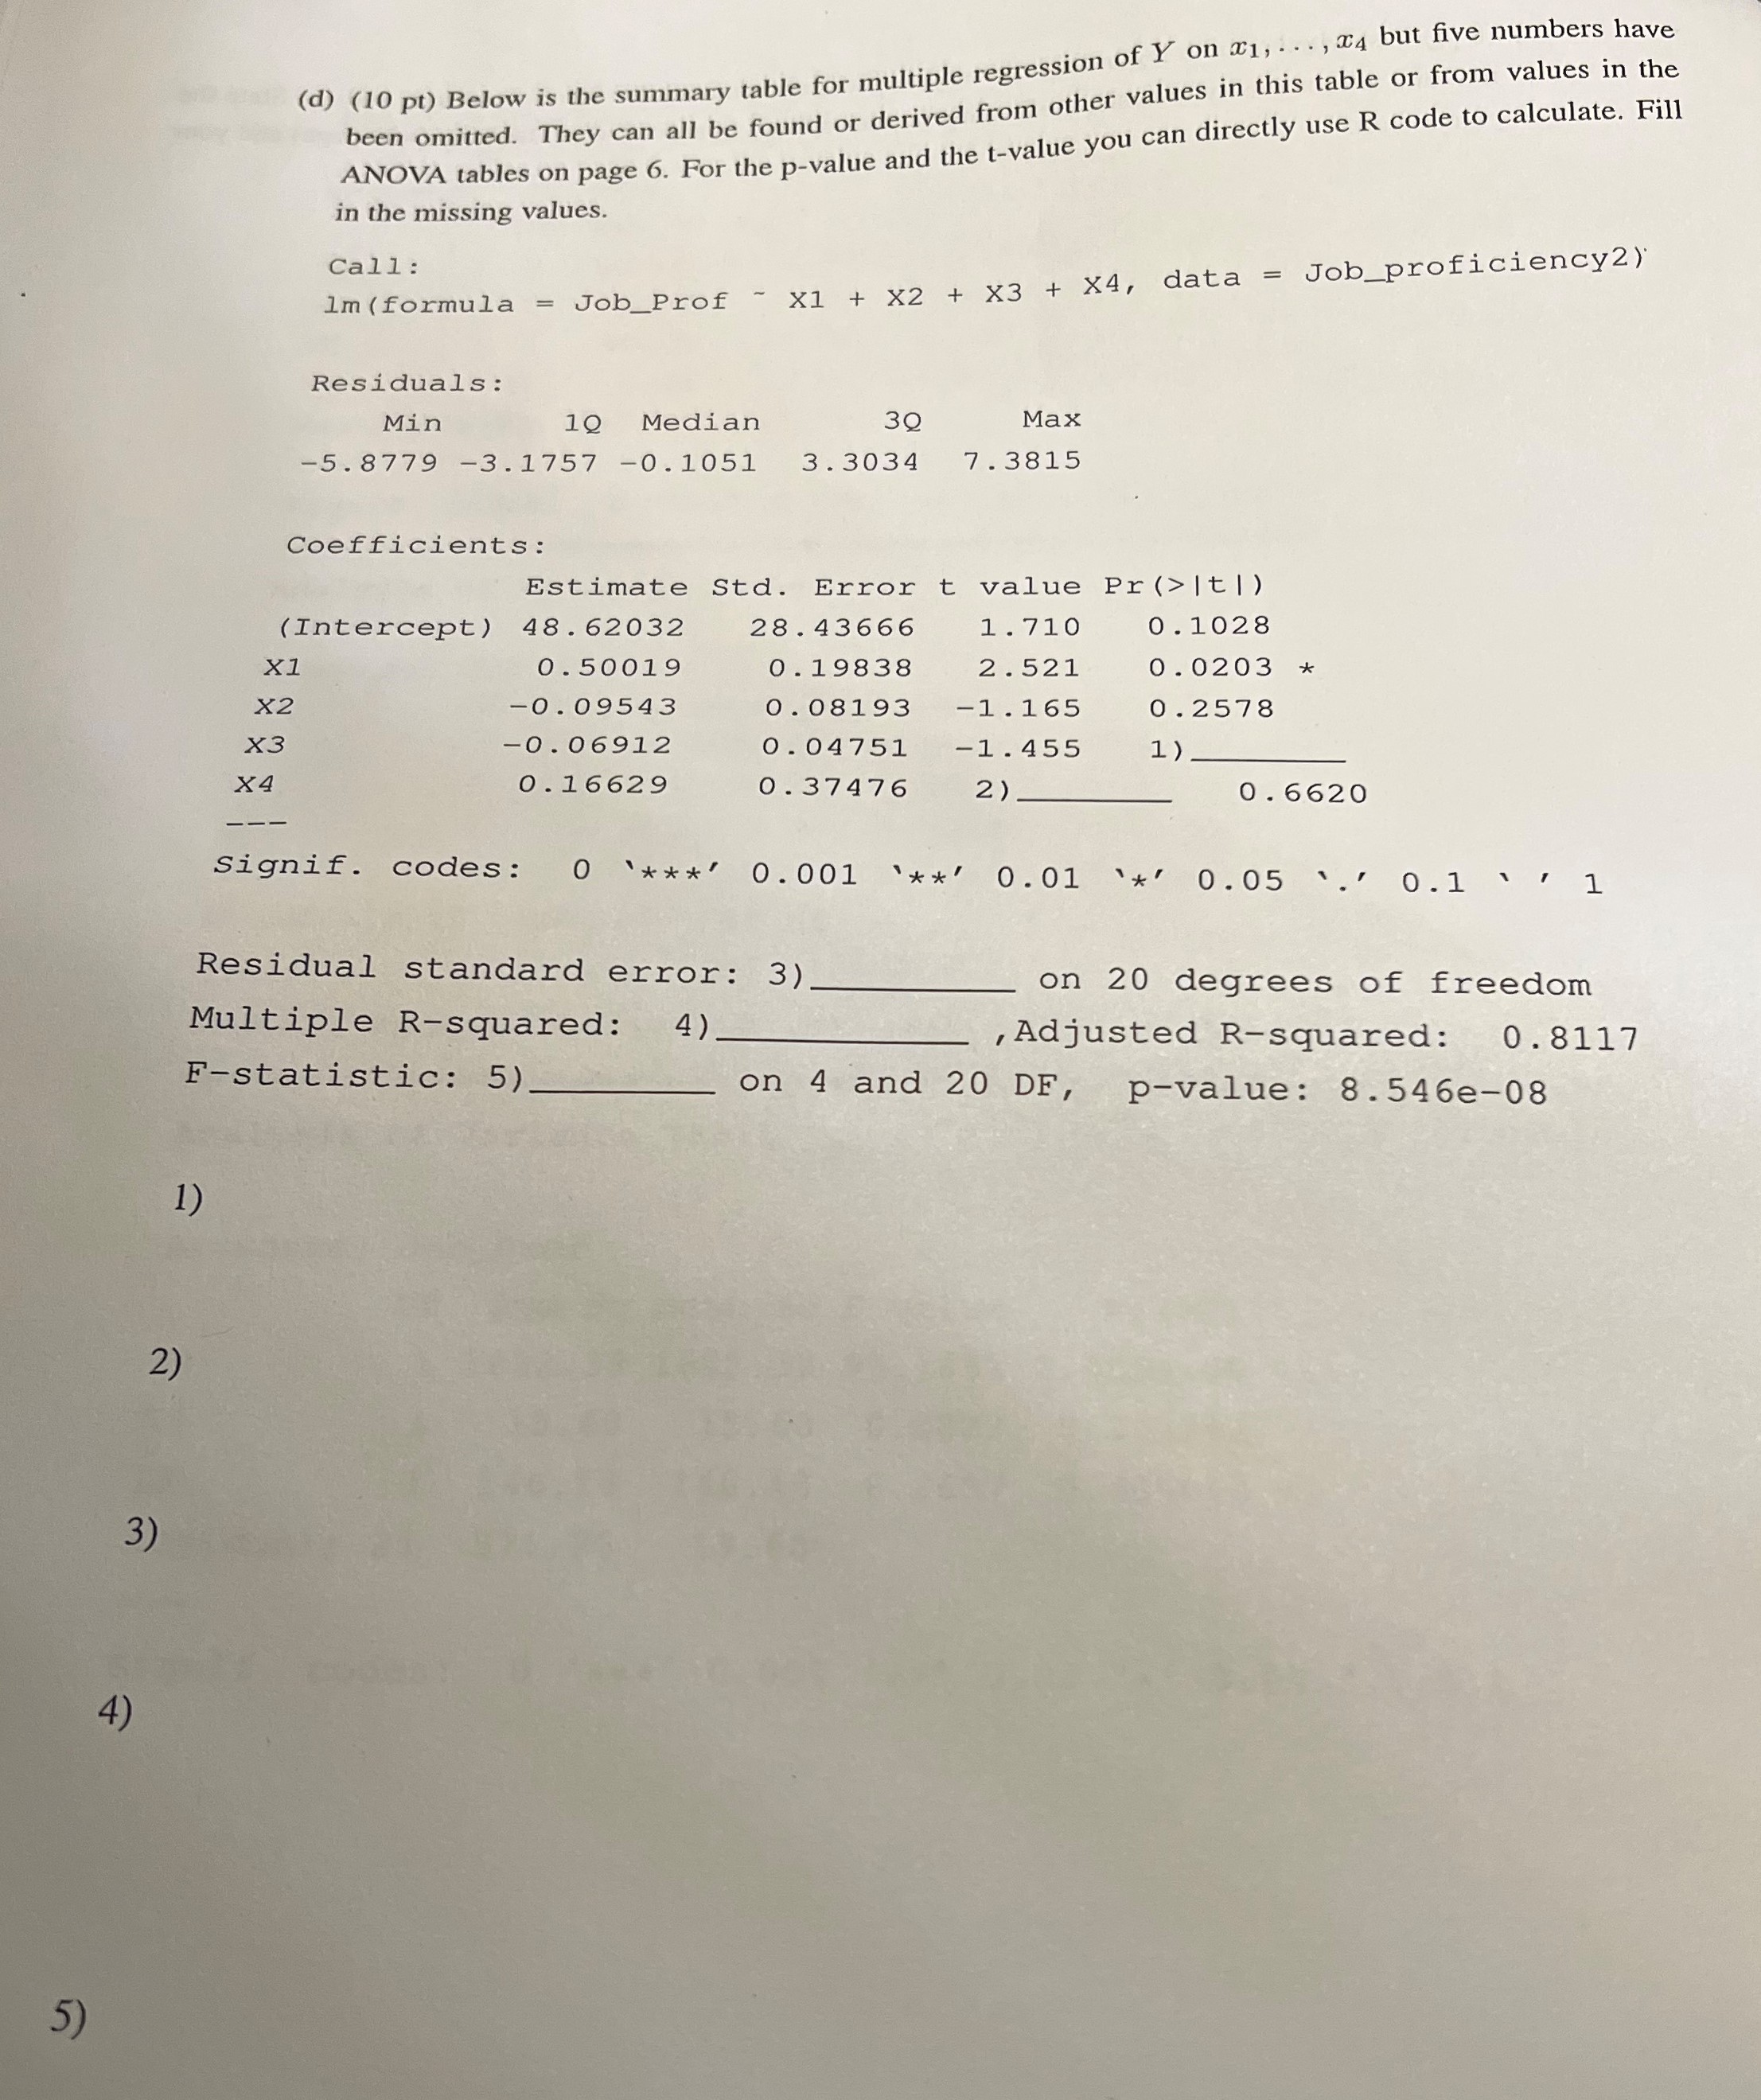
Analysis of Variance Table : ob_Prof >F Response :1 Sum Sq Mean Sq F value 0::;0; *** x1 1 1746.67 1746.67 100.4788 3.0 04818 * x2 1 76.99 76.99 4.4290 -14207 x3 1 40.61 40.61 2.3361 0- x4 1 3.42 3.42 0.1969 0.66200 Residuals 20 347.67 17.38 _\"Df Sum Sq Mean Sq F value Pr(>F) 151:1682.39 1682.39 96.7810 4.163e09 *** 136.33 136.33 7.8426 0.01105 * 12.18 12.18 0.7008 0.41242 -(36.79 36.79 2.1164 0.16124 (d) (10 pt) Below is the summary table for multiple regression of Y on 1, . . ., 4 but five numbers have been omitted. They can all be found or derived from other values in this table or from values in the ANOVA tables on page 6. For the p-value and the t-value you can directly use R code to calculate. Fill in the missing values. Call : im (formula = Job_Prof ~ X1 + x2 + x3 + X4, data = Job_proficiency2) Residuals : Min 10 Median 30 Max -5. 8779 -3.1757 -0. 1051 3 . 3034 7. 3815 Coefficients : Estimate Std. Error t value Pr (>It|) (Intercept) 48 . 62032 28 . 43666 1 . 710 0 . 1028 X1 0 . 50019 0 . 19838 2 . 521 0 . 0203 X2 -0 . 09543 0 . 08193 -1. 165 0 . 2578 X 3 -0 . 06912 0 . 04751 -1 . 455 1) X4 0 . 16629 0 . 37476 2 ) 0 . 6620 Signif. codes: 0 ' * * * ' 0. 001 ' * *' 0.01 '*' 0.05 0.1 1 Residual standard error: 3) on 20 degrees of freedom Multiple R-squared: 4 ) , Adjusted R-squared: 0 . 8117 F-statistic: 5). on 4 and 20 DF, p-value: 8. 546e-08 1 ) 2) 3 ) 4) 5)
Step by Step Solution
There are 3 Steps involved in it

Get step-by-step solutions from verified subject matter experts