

Question: Analysis of Variance Table Response : y Df Sum Sq Mean Sq F value Pr (>F) w1 1 1293.63 1293.63 70. 179 2.339e-06 *** w2
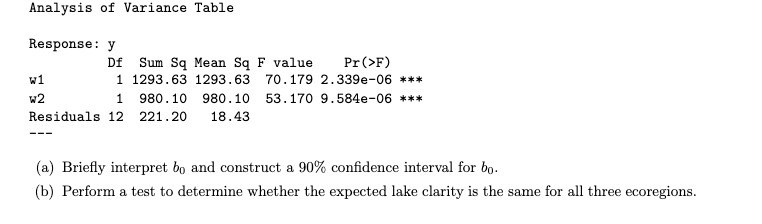
Analysis of Variance Table Response : y Df Sum Sq Mean Sq F value Pr (>F) w1 1 1293.63 1293.63 70. 179 2.339e-06 *** w2 1 980.10 980.10 53. 170 9.584e-06 *** Residuals 12 221.20 18.43 (a) Briefly interpret bo and construct a 90% confidence interval for bo. (b) Perform a test to determine whether the expected lake clarity is the same for all three ecoregions
Step by Step Solution
There are 3 Steps involved in it
1 Expert Approved Answer
Step: 1 Unlock

Question Has Been Solved by an Expert!
Get step-by-step solutions from verified subject matter experts
Step: 2 Unlock
Step: 3 Unlock