

Question: Analytics Case description: Consumer Debt Payments A recent study found that American consumers are making average monthly debt payments of around $1,000 (Source: Experian.com, November
Analytics Case description: Consumer Debt Payments A recent study found that American consumers are making average monthly debt payments of around $1,000 (Source: Experian.com, November 11, 2010). However, the study of 26 metropolitan areas reveals quite a bit of variation in debt payments, depending on where the consumer lives. For instance, in Washington DC, residents pay the most ($1,285 per month), while Pittsburgh residents pay the least ($763 per month). Madelyn Davis, an economist in a large bank, believes that income differences between cities are the primary reason for the disparate debt payments. For example, Washington DCs high incomes have likely contributed to it placement on the list. She is also unsure about the likely effect of unemployment rate on consumer debt payments. In order to analyze the relationship between income, unemployment rate, and consumer debt payments, Madelyn collected data from the same 26 metropolitan cities used in the earlier debt payment study. Specifically, she gathered each areas 2010 2011 median household income as well as the monthly unemployment rate and average consumer debt for August 2010. The Excel file GEProjectDatafall2019 has the data. (attached image) Madelyn would like to use this sample data to understand the relationships between (1) debt payments and income, and (2) debt payments and unemployment rate. Phase 1 (Proposal): Please complete the following tasks for this phase: a) Describe the problem background and purpose of the study b) Describe the variables included in the case c) Use appropriate descriptive statistics to explore and summarize the data, both numerical and graphical. Remember to interpret the findings accurately and present them in a clear and coherent way.
Phase 1: In this phase, the student will write up a project proposal (1 page maximum, same format as the final report) that will include a brief introduction, description of the data, the business questions to be answered, and basic exploratory analyses using descriptive statistics (graphs and numerical summary measures).
Your report should have the following sections (Phase 1 proposal; Phase 2 final report), arranged sequentially: 1. Introduction and problem background (Phase 1, Phase 2) 2. Data description and the business questions to be answered (Phase 1, Phase 2) 3. Initial data exploration descriptive statistics/graphs (Phase 1, Phase 2)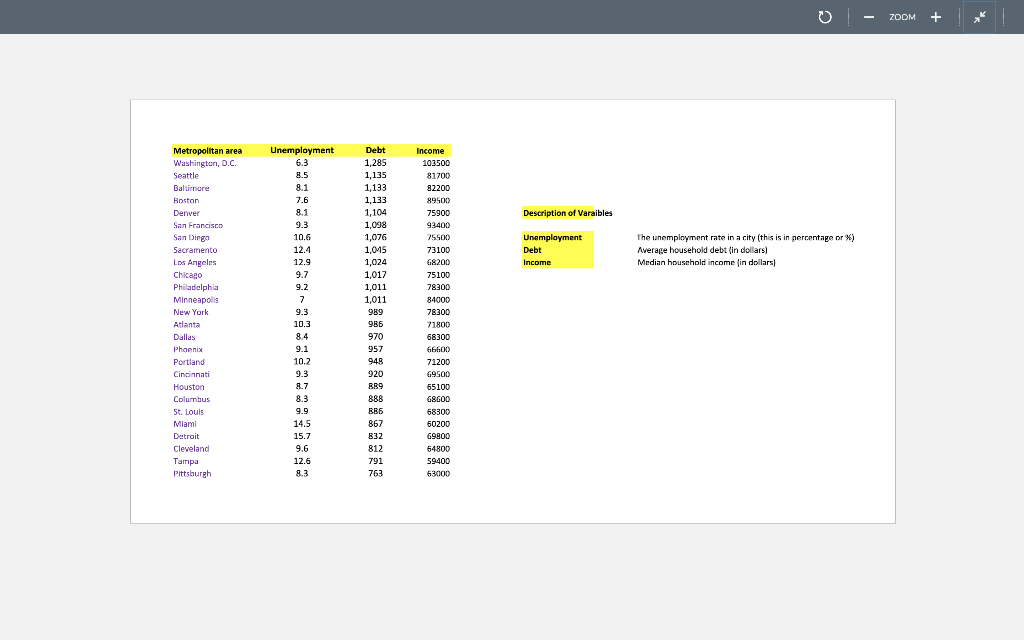
ZOOM Metropolitan area Washington, DC Seattle Baltimore Boston Denver San Francisco San Dingo Description of Varaibles Debt 1,285 1,135 1,133 1,133 1,104 1,098 1,076 1,015 1,024 1,017 1,011 1,011 989 Sacramento Unemployment Debt Income The unemployment rate in a city (this is in percentage or ) Average household debt (in dollars) ) Median household income in dollars) Unemployment 6.3 3.5 8.1 7.6 8.1 9.3 10.6 12.1 12.9 9.7 9.2 7 9.3 10.3 8.4 9.1 10.2 9.3 8.7 8.3 9.9 14.5 15.7 9.6 12.6 8.3 Los Angeles Chicago Philadelphia Minneapolis New York Atlanta Dallas Phoenix Portland Cincinnati Houston Columbus St. Louis Mlami Detroit Cleveland Tamripa Pittsburgh 180119190071 Income 103500 81700 82200 89500 75900 93400 75500 73100 68200 75100 78300 84000 78300 71800 68300 66600 71200 G9500 65100 68600 68300 50200 69800 64800 59400 63000 ZOOM Metropolitan area Washington, DC Seattle Baltimore Boston Denver San Francisco San Dingo Description of Varaibles Debt 1,285 1,135 1,133 1,133 1,104 1,098 1,076 1,015 1,024 1,017 1,011 1,011 989 Sacramento Unemployment Debt Income The unemployment rate in a city (this is in percentage or ) Average household debt (in dollars) ) Median household income in dollars) Unemployment 6.3 3.5 8.1 7.6 8.1 9.3 10.6 12.1 12.9 9.7 9.2 7 9.3 10.3 8.4 9.1 10.2 9.3 8.7 8.3 9.9 14.5 15.7 9.6 12.6 8.3 Los Angeles Chicago Philadelphia Minneapolis New York Atlanta Dallas Phoenix Portland Cincinnati Houston Columbus St. Louis Mlami Detroit Cleveland Tamripa Pittsburgh 180119190071 Income 103500 81700 82200 89500 75900 93400 75500 73100 68200 75100 78300 84000 78300 71800 68300 66600 71200 G9500 65100 68600 68300 50200 69800 64800 59400 63000
Step by Step Solution
There are 3 Steps involved in it

Get step-by-step solutions from verified subject matter experts