

Question: Analyze and explain this DDM Model: Date Dividends 4/15/2024 2019 795.41 2020 795.41 1,216 994.26 707 994.26 2021 2022 2023 2024E 2025E 2026E 2027E 2028E
Analyze and explain this DDM Model:
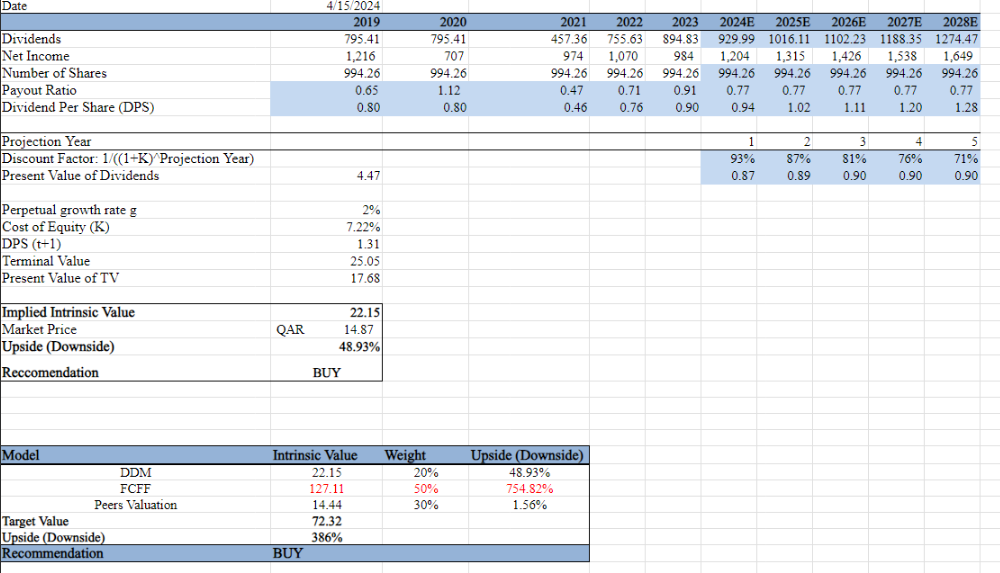
Date Dividends 4/15/2024 2019 795.41 2020 795.41 1,216 994.26 707 994.26 2021 2022 2023 2024E 2025E 2026E 2027E 2028E 457.36 755.63 894.83 929.99 1016.11 1102.23 1188.35 1274.47 974 1,070 984 1,204 1,315 1,426 1,538 1,649 994.26 994.26 994.26 994.26 994.26 994.26 994.26 994.26 0.65 1.12 0.47 0.71 0.91 0.77 0.77 0.77 0.77 0.77 0.80 0.80 0.46 0.76 0.90 0.94 1.02 1.11 1.20 1.28 Net Income Number of Shares Payout Ratio Dividend Per Share (DPS) Projection Year Discount Factor: 1/((1+K) Projection Year) Present Value of Dividends 4.47 Perpetual growth rate g Cost of Equity (K) DPS (t+1) Terminal Value Present Value of TV Implied Intrinsic Value Market Price Upside (Downside) Reccomendation 2% 7.22% 1.31 25.05 17.68 22.15 QAR 14.87 48.93% BUY Model DDM FCFF Peers Valuation Target Value Upside (Downside) Recommendation Intrinsic Value Weight 22.15 20% 127.11 50% 14.44 30% 72.32 386% BUY Upside (Downside) 48.93% 754.82% 1.56% 1 2 3 4 5 93% 87% 81% 76% 71% 0.87 0.89 0.90 0.90 0.90
Step by Step Solution
There are 3 Steps involved in it

Get step-by-step solutions from verified subject matter experts