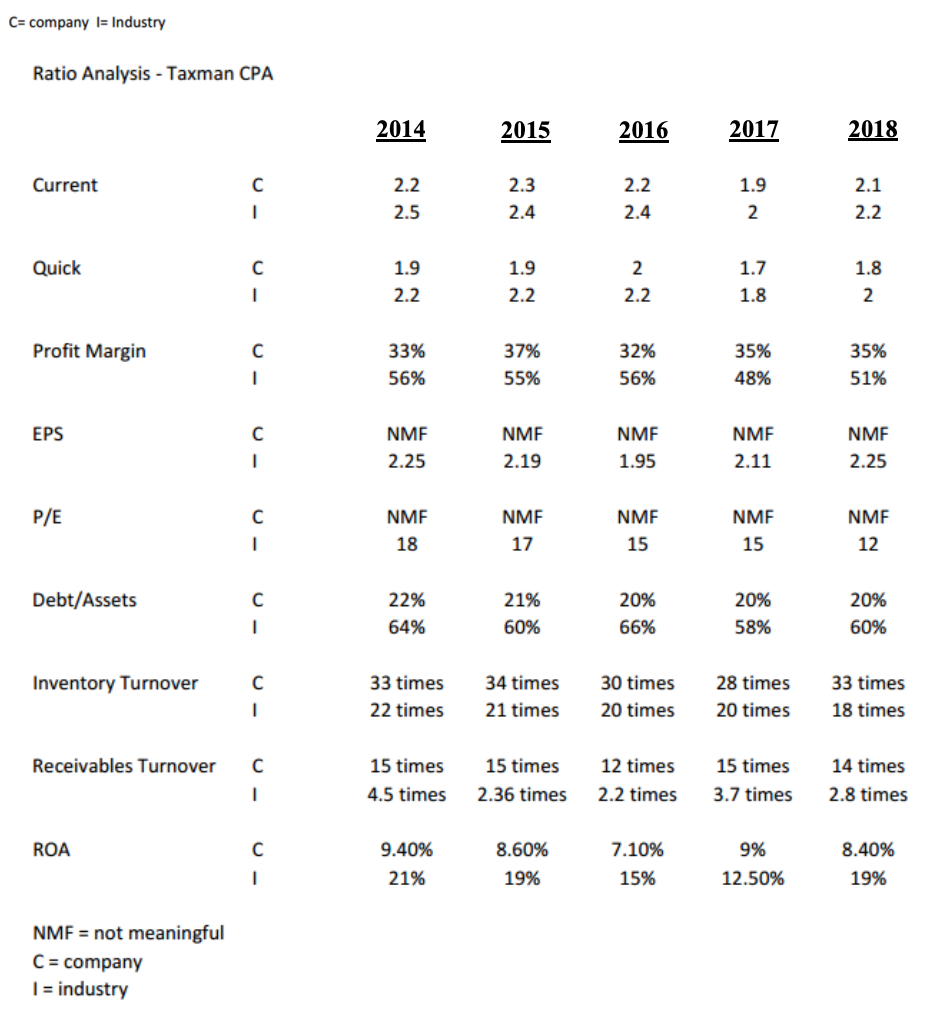
Question: Analyze each case utilizing the ratios and methods. What type of company is it? Is the company doing well or poorly? What is its overall

Analyze each case utilizing the ratios and methods.

What type of company is it? Is the company doing well or poorly? What is its overall financial position? If multiple years are available, what is happening at the company over time based on the ratios given? How does the company compare to its industry either now or over time? What ratios need to improve and how? Which ratios are strong and why?

Show a multiple-year trend analysis

Analyze each case utilizing the ratios and
C= company |= Industry Ratio Analysis - Taxman CPA 2014 2015 2016 2017 2018 Current 2.2 2.3 2.2 1.9 2.1 - n 2.5 2.4 2.4 2 2.2 Quick 1.9 1.9 2 1.7 1.8 - Q 2.2 2.2 2.2 1.8 2 Profit Margin 33% 37% 32% 35% 35% - n 56% 55% 56% 48% 51% EPS NMF NMF NMF NMF NMF - n 2.25 2.19 1.95 2.11 2.25 P/E NMF NMF NMF NMF NMF - 0 18 17 15 15 12 Debt/Assets 22% 21% 20% 20% 20% - 0 64% 60% 66% 58% 60% Inventory Turnover 33 times 34 times 30 times 28 times 33 times - n 22 times 21 times 20 times 20 times 18 times Receivables Turnover 15 times 15 times 12 times 15 times 14 times - n 4.5 times 2.36 times 2.2 times 3.7 times 2.8 times ROA 9.40% 8.60% 7.10% 9% 8.40% - n 21% 19% 15% 12.50% 19% NMF = not meaningful C = company I = industry

Step by Step Solution

There are 3 Steps involved in it

1 Expert Approved Answer
Step: 1 Unlock blur-text-image
Question Has Been Solved by an Expert!

Get step-by-step solutions from verified subject matter experts

Step: 2 Unlock
Step: 3 Unlock

Students Have Also Explored These Related Finance Questions!