

Question: Analyze each case utilizing the ratios and methods. What type of company is it? Is the company doing well or poorly? What is its overall
Analyze each case utilizing the ratios and methods.
What type of company is it? Is the company doing well or poorly? What is its overall financial position? If multiple years are available, what is happening at the company over time based on the ratios given? How does the company compare to its industry either now or over time? What ratios need to improve and how? Which ratios are strong and why?
Although dollar amounts are not provided, it is still possible to complete a multiple-year trend analysis of ratios for two of the cases.
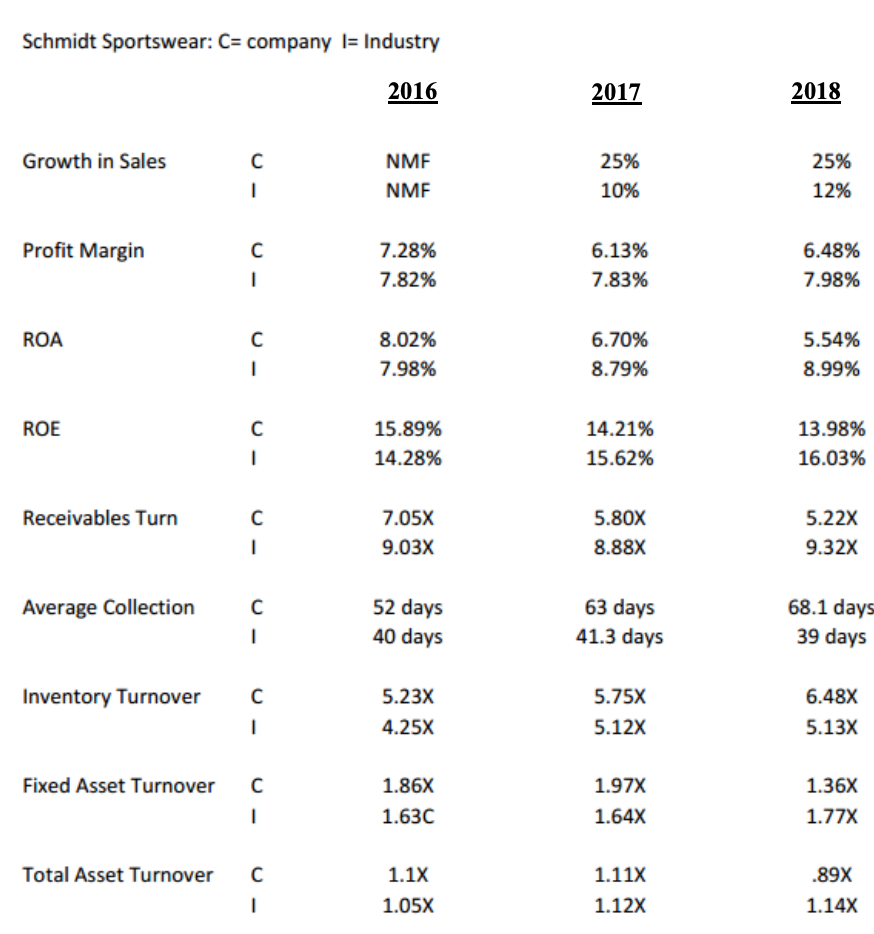
Schmidt Sportswear: C= company I= Industry 2016 2017 2018 Growth in Sales NMF NMF 25% 10% 25% 12% 1 Profit Margin 7.28% 7.82% 6.13% 7.83% 6.48% 7.98% 1 ROA 1 8.02% 7.98% 6.70% 8.79% 5.54% 8.99% ROE 15.89% 14.28% 14.21% 15.62% 13.98% 16.03% 1 Receivables Turn 1 7.05X 9.03X 5.80x 8.88X 5.22x 9.32x Average Collection C 1 52 days 40 days 63 days 41.3 days 68.1 days 39 days Inventory Turnover 5.23X 4.25X 5.75X 5.12x 6.48X 5.13x 1 Fixed Asset Turnover 1.86X 1.63C 1.97X 1.64x 1.36X 1.77x 1 Total Asset Turnover 1.1x .89x 1.11% 1.12x 1 1.05X 1.14x
Step by Step Solution
There are 3 Steps involved in it

Get step-by-step solutions from verified subject matter experts