

Question: Analyze the banks return, risk, and accounting performance. Create a table with the list of relevant ratios for 2020,2019 and 2018. Show Work preferably in
Analyze the banks return, risk, and accounting performance. Create a table with the list of relevant ratios for 2020,2019 and 2018. Show Work preferably in Excel.
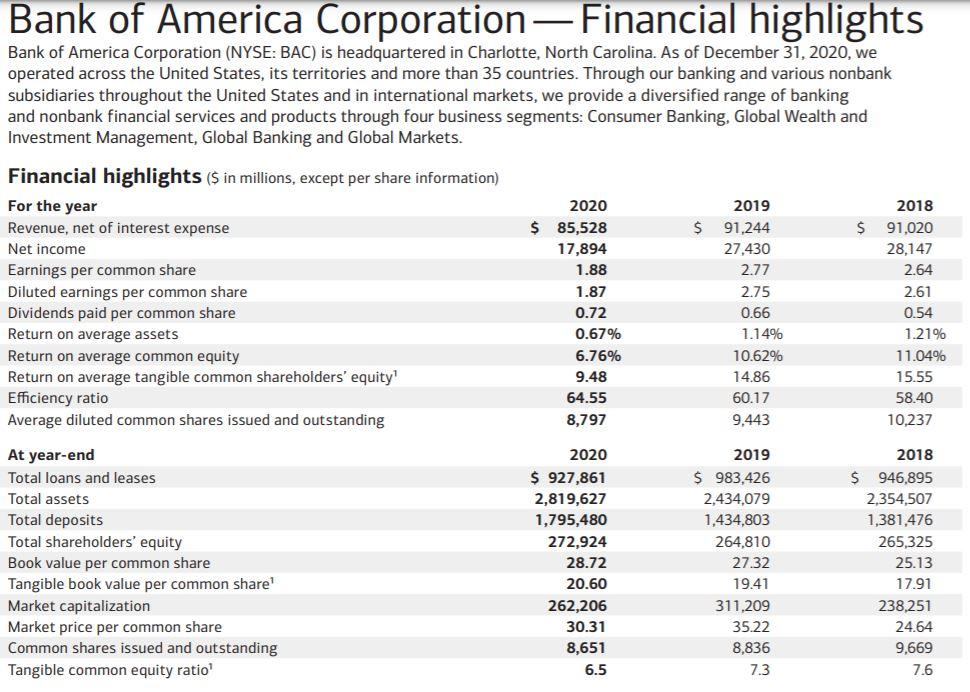
Bank of America Corporation Financial highlights Bank of America Corporation (NYSE: BAC) is headquartered in Charlotte, North Carolina. As of December 31, 2020, we operated across the United States, its territories and more than 35 countries. Through our banking and various nonbank subsidiaries throughout the United States and in international markets, we provide a diversified range of banking and nonbank financial services and products through four business segments: Consumer Banking, Global Wealth and Investment Management, Global Banking and Global Markets. $ Financial highlights ($ in millions, except per share information) For the year Revenue, net of interest expense Net income Earnings per common share Diluted earnings per common share Dividends paid per common share Return on average assets Return on average common equity Return on average tangible common shareholders' equity Efficiency ratio Average diluted common shares issued and outstanding 2020 $ 85,528 17,894 1.88 1.87 0.72 0.67% 6.76% 2019 $ 91,244 27,430 2.77 2.75 0.66 1.14% 10.62% 14.86 60.17 9,443 2018 91,020 28,147 2.64 2.61 0.54 1.21% 11.04% 15.55 58.40 10,237 9.48 64.55 8,797 At year-end Total loans and leases Total assets Total deposits Total shareholders' equity Book value per common share Tangible book value per common share! Market capitalization Market price per common share Common shares issued and outstanding Tangible common equity ratio 2020 $ 927,861 2,819,627 1,795,480 272,924 28.72 20.60 262,206 30.31 8,651 6.5 2019 $ 983,426 2,434,079 1,434,803 264,810 27.32 19.41 311,209 35.22 8,836 7.3 2018 $946,895 2,354,507 1,381,476 265,325 25.13 17.91 238,251 24.64 9,669 7.6 Bank of America Corporation Financial highlights Bank of America Corporation (NYSE: BAC) is headquartered in Charlotte, North Carolina. As of December 31, 2020, we operated across the United States, its territories and more than 35 countries. Through our banking and various nonbank subsidiaries throughout the United States and in international markets, we provide a diversified range of banking and nonbank financial services and products through four business segments: Consumer Banking, Global Wealth and Investment Management, Global Banking and Global Markets. $ Financial highlights ($ in millions, except per share information) For the year Revenue, net of interest expense Net income Earnings per common share Diluted earnings per common share Dividends paid per common share Return on average assets Return on average common equity Return on average tangible common shareholders' equity Efficiency ratio Average diluted common shares issued and outstanding 2020 $ 85,528 17,894 1.88 1.87 0.72 0.67% 6.76% 2019 $ 91,244 27,430 2.77 2.75 0.66 1.14% 10.62% 14.86 60.17 9,443 2018 91,020 28,147 2.64 2.61 0.54 1.21% 11.04% 15.55 58.40 10,237 9.48 64.55 8,797 At year-end Total loans and leases Total assets Total deposits Total shareholders' equity Book value per common share Tangible book value per common share! Market capitalization Market price per common share Common shares issued and outstanding Tangible common equity ratio 2020 $ 927,861 2,819,627 1,795,480 272,924 28.72 20.60 262,206 30.31 8,651 6.5 2019 $ 983,426 2,434,079 1,434,803 264,810 27.32 19.41 311,209 35.22 8,836 7.3 2018 $946,895 2,354,507 1,381,476 265,325 25.13 17.91 238,251 24.64 9,669 7.6
Step by Step Solution
There are 3 Steps involved in it

Get step-by-step solutions from verified subject matter experts