

Question: Analyze the chart below as a technical analyst using the grid format provided. You may make reference to trends, patterns, indicators, and the various signals
Analyze the chart below as a technical analyst using the grid format provided. You may make reference to trends, patterns, indicators, and the various signals they give you. Make a recommendation for the stock currently, substantiating your suggestion with technical evidence. You may make reference to the chart in your answer.
ANSWER:
Indicator Comments Bullish/bearish
Price:
Moving Average:
Bollinger Bands
Volume
RSI
Stochastics
Moving Average Convergence/Divergence indicator:
DECISION:
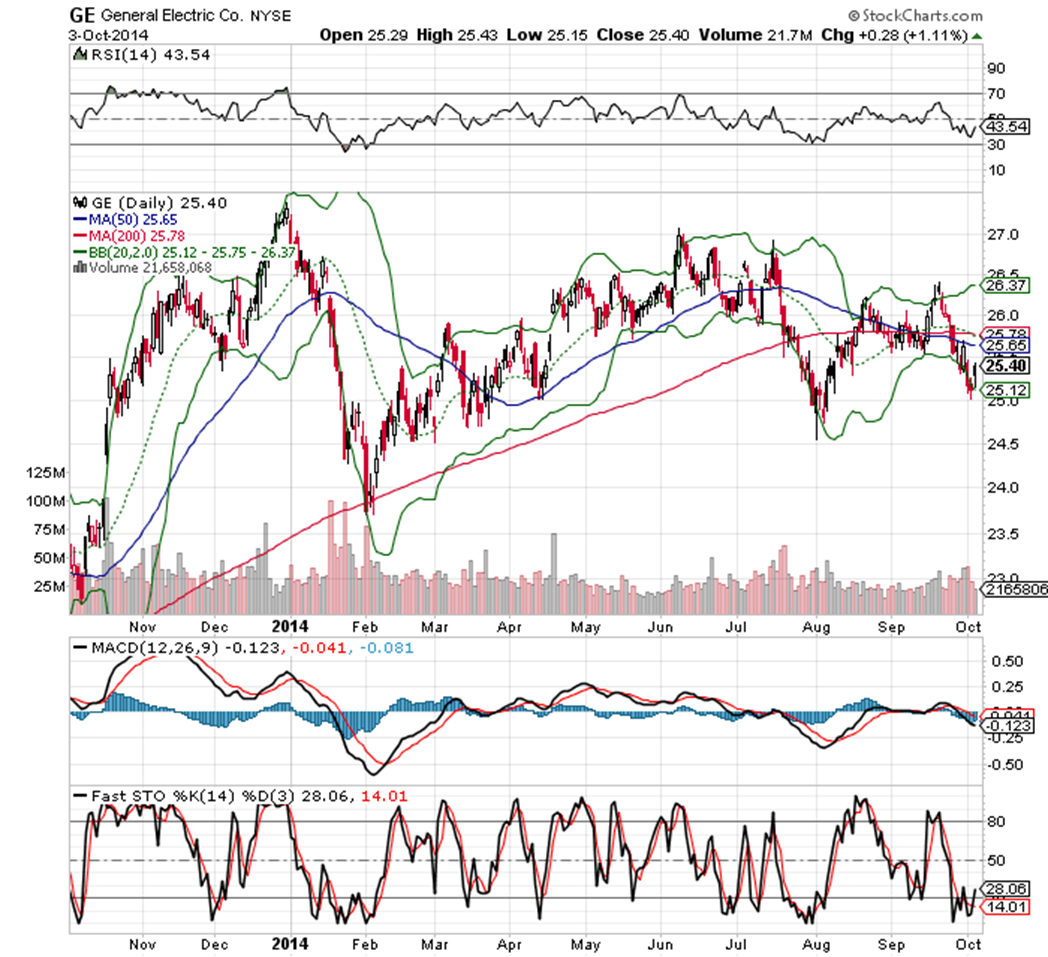
GE General Electric Co. NYSE 3-Oct-2014 MRSI(14) 43.54 StockCharts.com Open 25.29 High 25.43 Low 25.15 Close 25.40 Volume 21.7M Chg +0.28 (+1.11%) 90 70 W 43.54 30 10 4 GE (Daily) 25.40 -MA(50) 25.65 -MA(200) 25.78 -BB(20,2.0) 25.12 - 25.75 -26.37 din Volume 21,658,068 27.0 28.5 26.37 26.0 26 79 25.65 25.40 25.12 ZOU me heren 24.5 125M 24.0 100M 75M 23.5 50M 25M 220 2165806 Apr May Jun Jul Aug Sep Oct Nov Dec 2014 Feb Mar MACD(12,26,9) -0.123, -0.041, -0.081 0.50 0.25 044 -0.123 -U.25 -0.50 - Fast STO %K(14) %D(3) 28.06, 14.01 , ; 28.06) 14.01 Nov Dec 2014 Feb Mar Apr May Jun Jul Aug Sep Oct
Step by Step Solution
There are 3 Steps involved in it

Get step-by-step solutions from verified subject matter experts