

Question: Analyze the chart below as a technical analyst using the grid format provided. You may make reference to trends, patterns, indicators, and the various signals
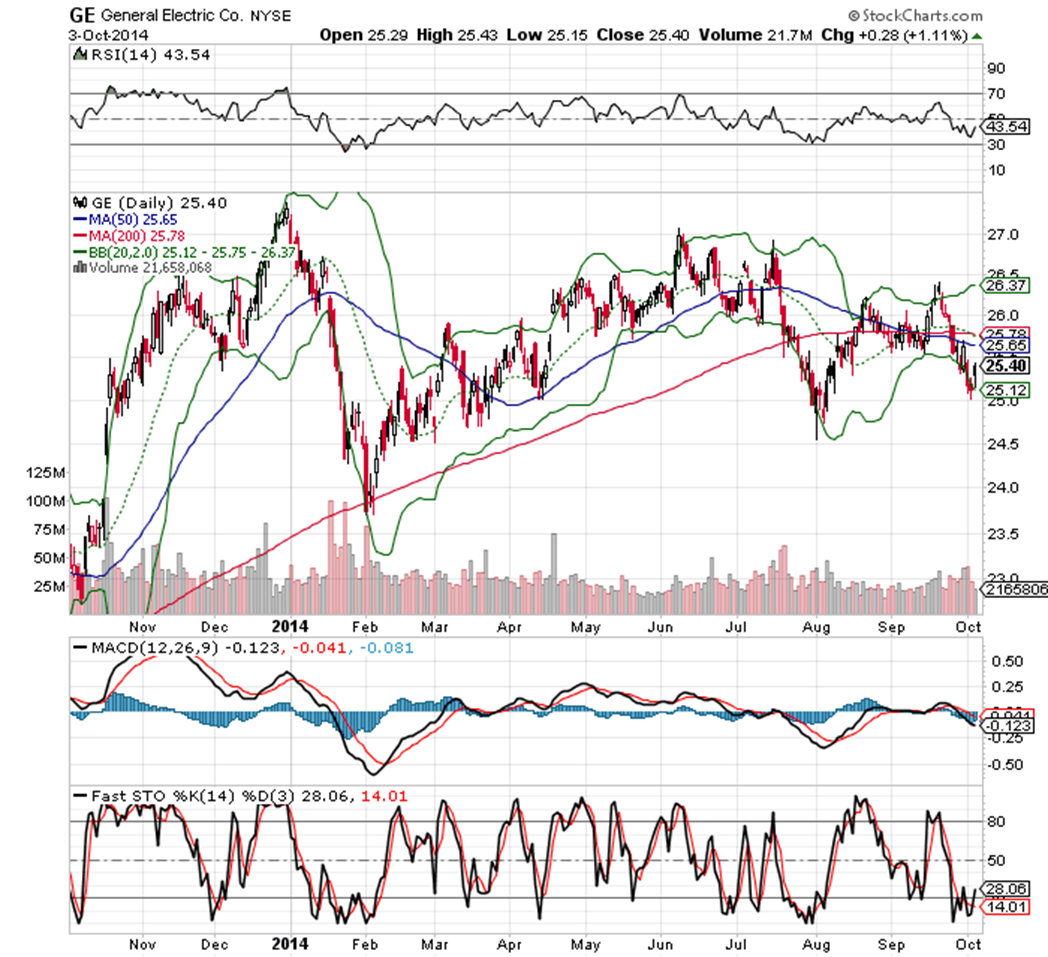
Analyze the chart below as a technical analyst using the grid format provided. You may make reference to trends, patterns, indicators, and the various signals they give you. Make a recommendation for the stock currently, substantiating your suggestion with technical evidence. You may make reference to the chart in your answer.
ANSWER:
Indicator CommentsBullish/bearish
Price:
Moving Average:
Bollinger Bands
Volume
RSI
Stochastics
Moving Average Convergence/Divergence indicator:
DECISION:
Step by Step Solution
There are 3 Steps involved in it
1 Expert Approved Answer
Step: 1 Unlock

Question Has Been Solved by an Expert!
Get step-by-step solutions from verified subject matter experts
Step: 2 Unlock
Step: 3 Unlock