

Question: . Analyze the data in this table to determine whether they can be modeled with a - quadratic function. 0.2 0.2 0.2 0.2 0.2
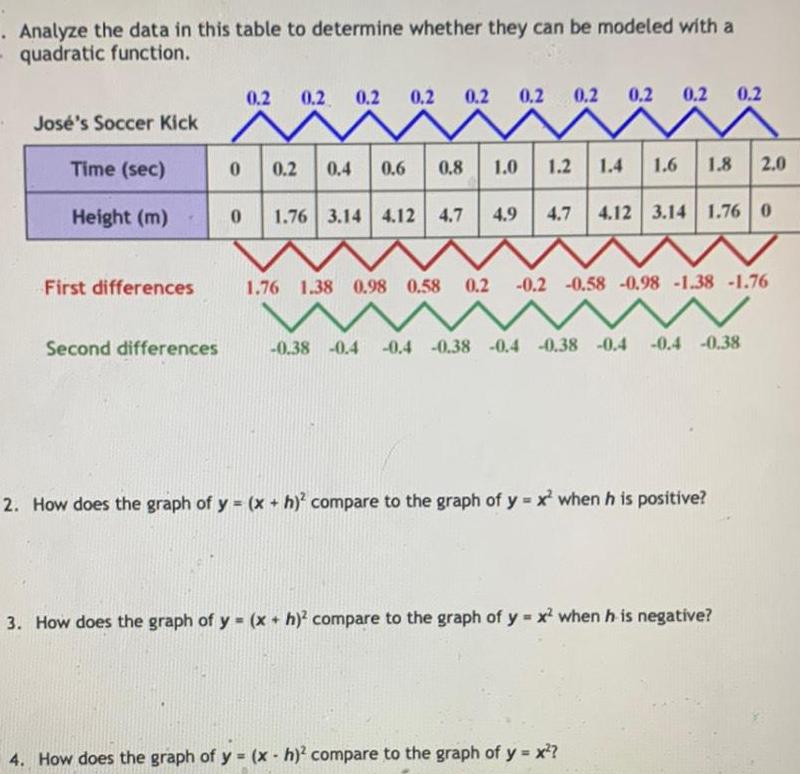
. Analyze the data in this table to determine whether they can be modeled with a - quadratic function. 0.2 0.2 0.2 0.2 0.2 0.2 0.2 0.2 0.2 0.2 Jos's Soccer Kick N Time (sec) 0 0.2 0.4 0.6 0.8 1.0 1.2 1.4 1.6 1.8 2.0 Height (m) 0 1.76 3.14 4.12 4.7 4.9 4.7 4.12 3.14 1.76 0 First differences 1.76 1.38 0.98 0.58 0.2 -0.2 -0.58 -0.98 -1.38 -1.76 Second differences -0.38 -0.4 -0.4 -0.38 -0.4 -0.38 -0.4 -0.4 -0.38 2. How does the graph of y = (x + h) compare to the graph of y = x when his positive? 3. How does the graph of y = (x + h)2 compare to the graph of y = x when h is negative? 4. How does the graph of y = (x - h)2 compare to the graph of y = x?
Step by Step Solution
There are 3 Steps involved in it

Get step-by-step solutions from verified subject matter experts