

Question: Analyze the NO x equilibrium by first constructing the corresponding vant Hoff graph and comparing it with the information available in Chapter 16 and then
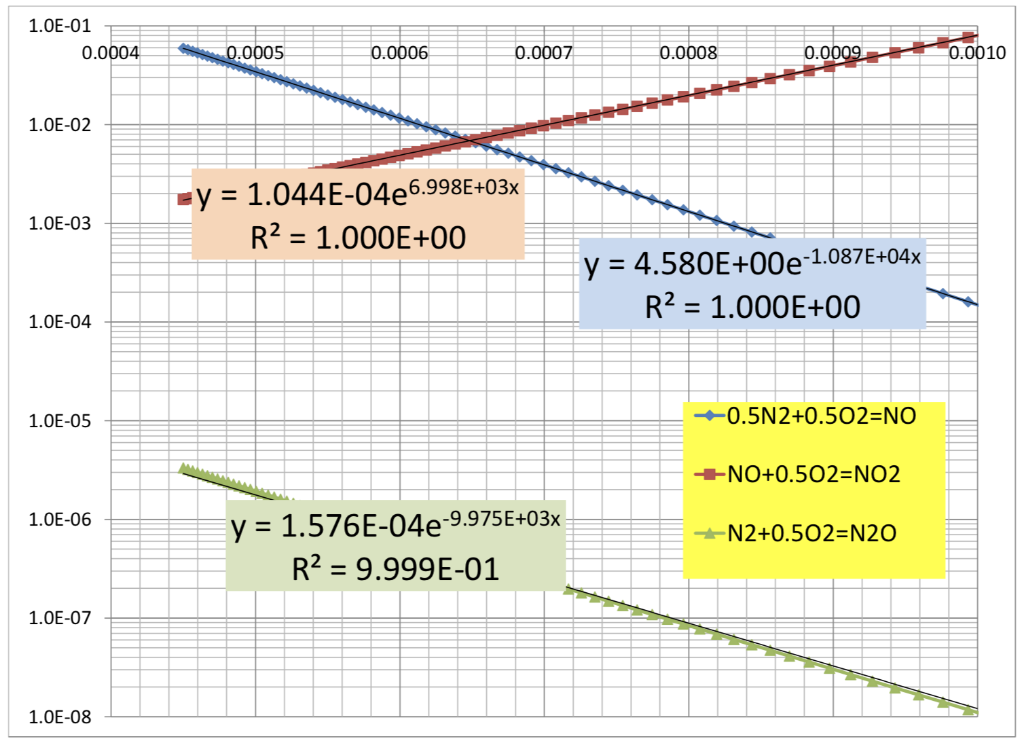
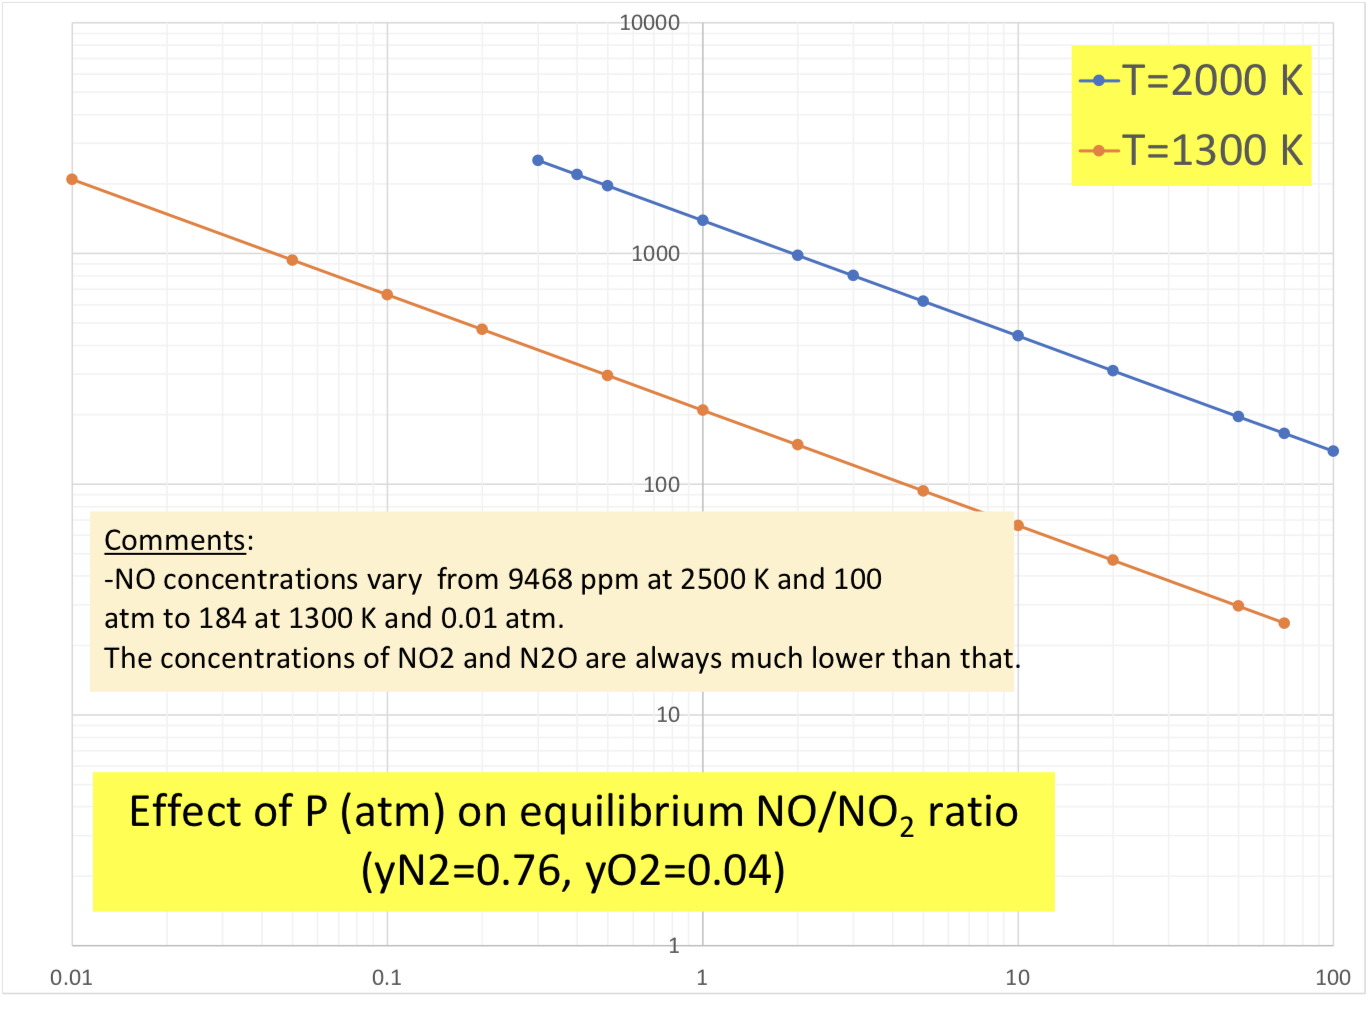
Analyze the NOx equilibrium by first constructing the corresponding vant Hoff graph and comparing it with the information available in Chapter 16 and then summarizing the NO/NO2 (and N2O/NO?) dependence on P and T. Explain how this confirms, of course, the validity of the Le Chatelier principle. -Do some of your graphs look like this?
can you explain or show work on how to do this graphs
1.0E-01 0.0004 0.0005 0.0006 0.0007 0.0008 0.0009 0.0010 1.0E-02 1.0E-03 +y = 1.044E-04e6.998E+03x R2 = 1.000E+00 = y = 4.580E+00e-1.087E+04x R2 = 1.000E+00 = 1.0E-04 1.0E-05 -0.5N2+0.502=NO +NO+0.502=NO2 1.0E-06 +-N2+0.502=N20 y = 1.576E-04e-9.975E+03x R2 = 9.999E-01 1.0E-07 1.0E-08 10000 -T=2000 K -T=1300 K 1000 100 Comments: -NO concentrations vary from 9468 ppm at 2500 K and 100 atm to 184 at 1300 K and 0.01 atm. The concentrations of NO2 and N20 are always much lower than that. 10 Effect of P (atm) on equilibrium NO/NO, ratio (yN2=0.76, yO2=0.04) 1 0.01 0.1 1 10 100 1.0E-01 0.0004 0.0005 0.0006 0.0007 0.0008 0.0009 0.0010 1.0E-02 1.0E-03 +y = 1.044E-04e6.998E+03x R2 = 1.000E+00 = y = 4.580E+00e-1.087E+04x R2 = 1.000E+00 = 1.0E-04 1.0E-05 -0.5N2+0.502=NO +NO+0.502=NO2 1.0E-06 +-N2+0.502=N20 y = 1.576E-04e-9.975E+03x R2 = 9.999E-01 1.0E-07 1.0E-08 10000 -T=2000 K -T=1300 K 1000 100 Comments: -NO concentrations vary from 9468 ppm at 2500 K and 100 atm to 184 at 1300 K and 0.01 atm. The concentrations of NO2 and N20 are always much lower than that. 10 Effect of P (atm) on equilibrium NO/NO, ratio (yN2=0.76, yO2=0.04) 1 0.01 0.1 1 10 100
Step by Step Solution
There are 3 Steps involved in it

Get step-by-step solutions from verified subject matter experts