Question: Analyze the Specialty Packing Company Case A in chapter 7 of your text. Specifically, develop a forecast for both products using the template spreadsheet. Analyze
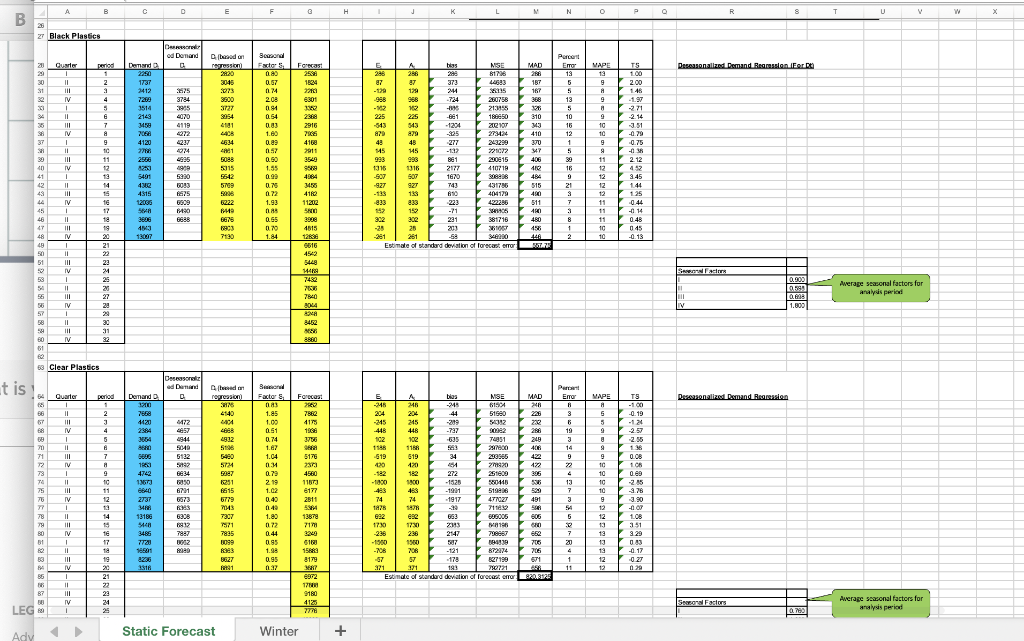
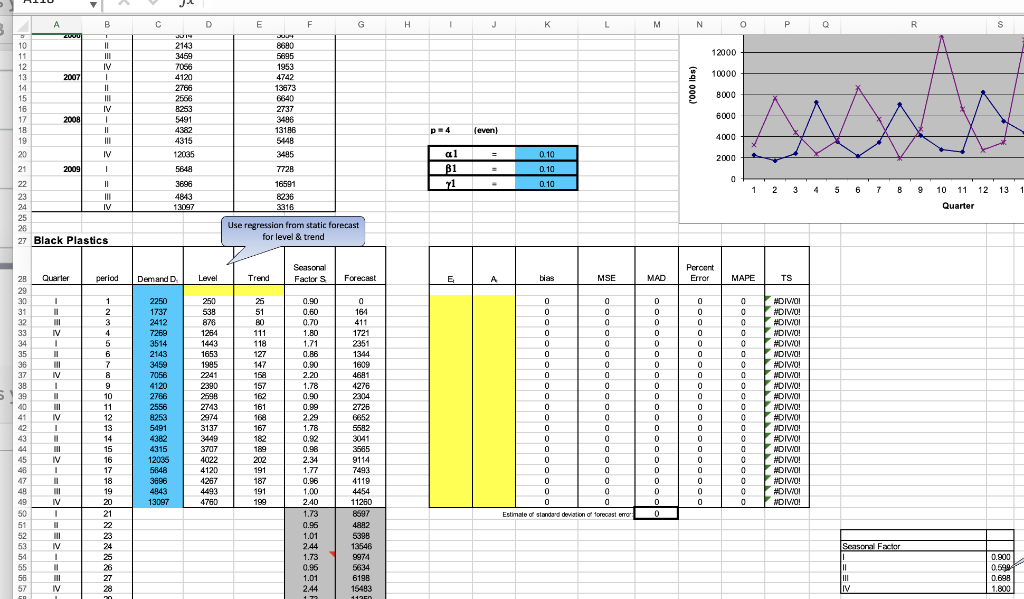
"Analyze the Specialty Packing Company Case A in chapter 7 of your text. Specifically, develop a forecast for both products using the template spreadsheet. Analyze which method you would suggest and justify your answer. The template file is provided with some equations already entered, you must create equations for cells highlighted in yellow."
Could someone check my spreadsheets (answers in yellow) and let me know if I am on the right track with the equations? I used the static method - or should I be using a different one? Which method would be best to use and why?
And, could someone help me with the equations for the blank yellow cells on the last photo?
Thanks!
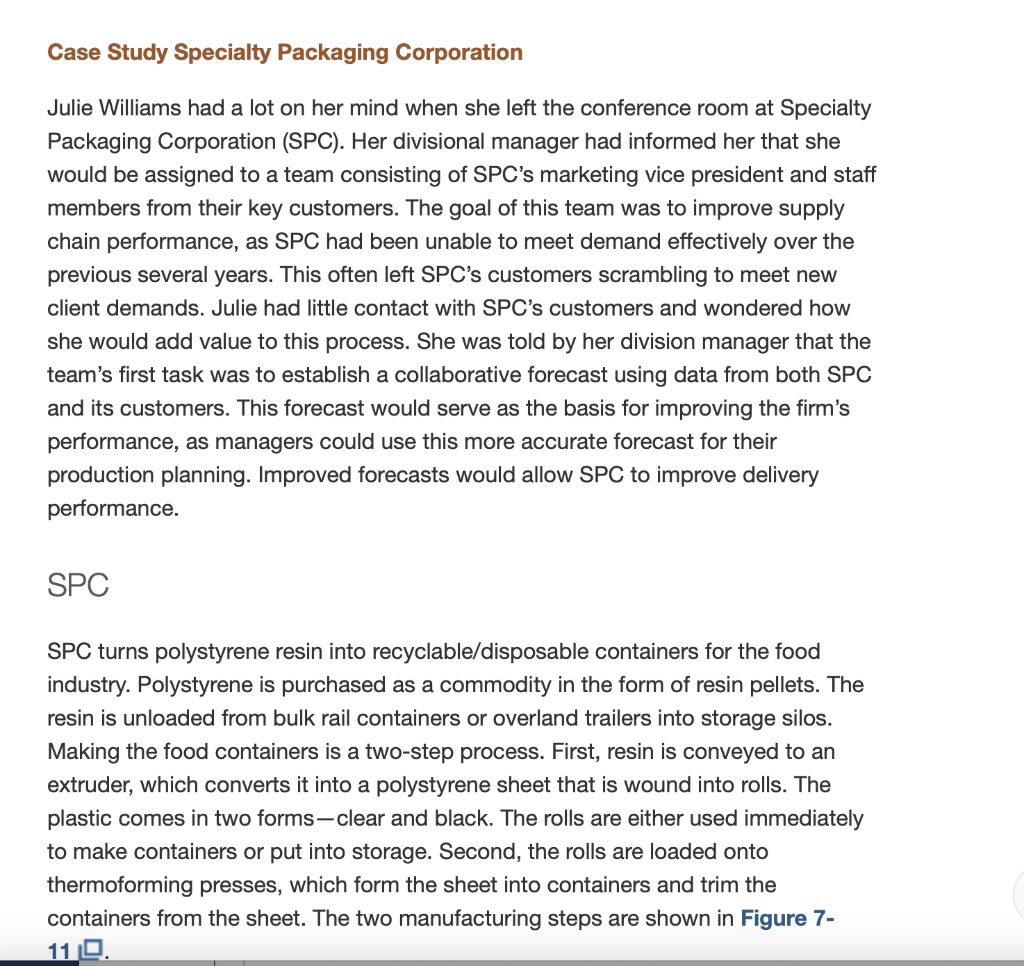
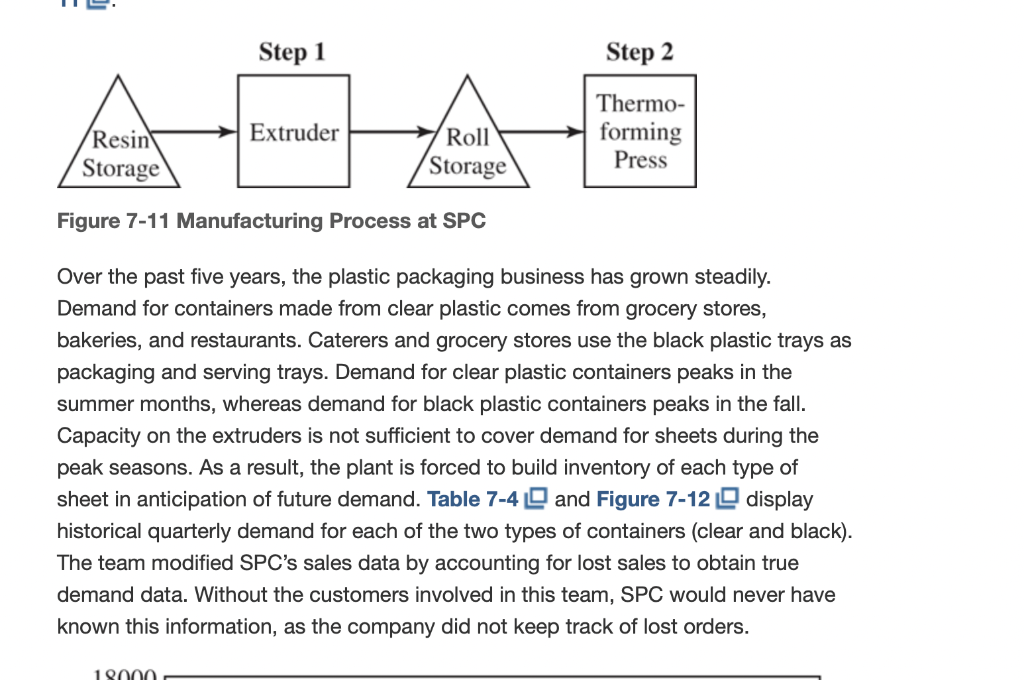
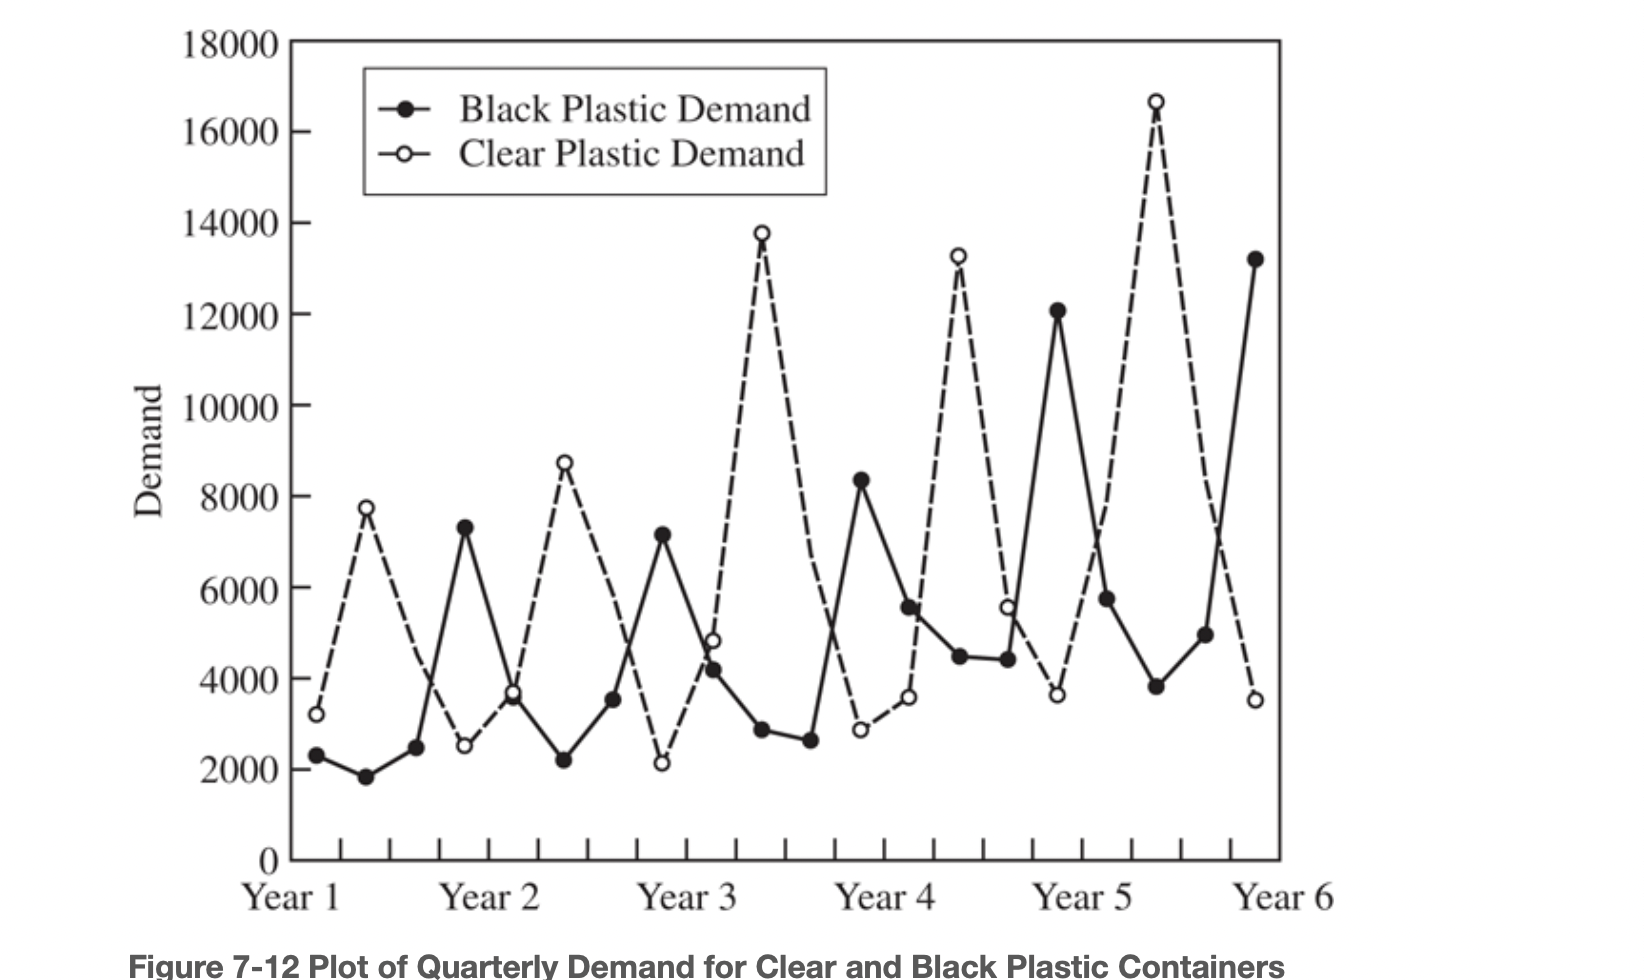
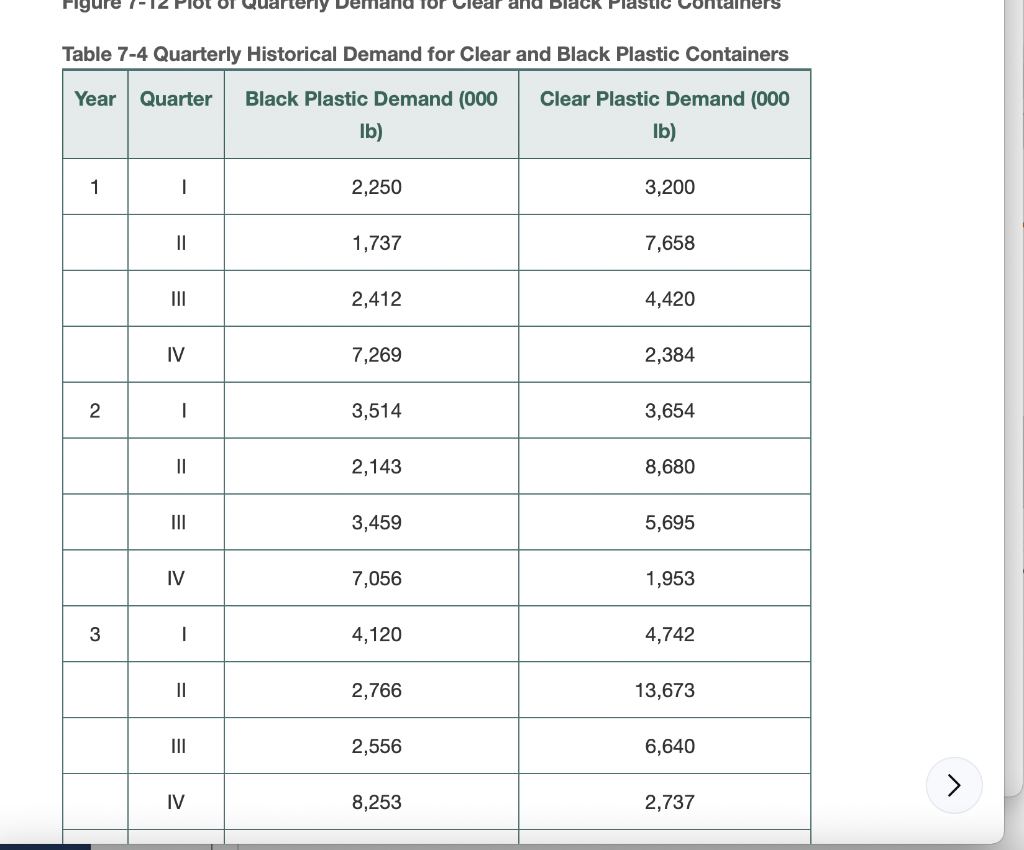
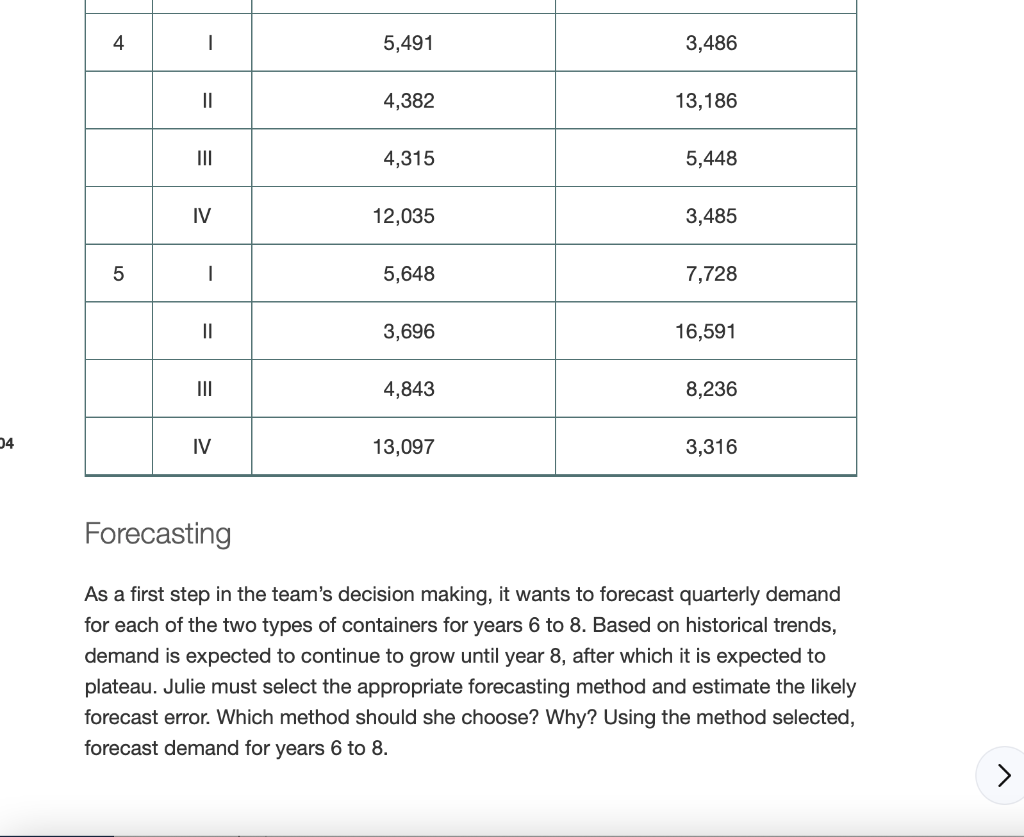
Case Study Specialty Packaging Corporation Julie Williams had a lot on her mind when she left the conference room at Specialty Packaging Corporation (SPC). Her divisional manager had informed her that she would be assigned to a team consisting of SPC's marketing vice president and staff members from their key customers. The goal of this team was to improve supply chain performance, as SPC had been unable to meet demand effectively over the previous several years. This often left SPC's customers scrambling to meet new client demands. Julie had little contact with SPC's customers and wondered how she would add value to this process. She was told by her division manager that the team's first task was to establish a collaborative forecast using data from both SPC and its customers. This forecast would serve as the basis for improving the firm's performance, as managers could use this more accurate forecast for their production planning. Improved forecasts would allow SPC to improve delivery performance. SPC SPC turns polystyrene resin into recyclable/disposable containers for the food industry. Polystyrene is purchased as a commodity in the form of resin pellets. The resin is unloaded from bulk rail containers or overland trailers into storage silos. Making the food containers is a two-step process. First, resin is conveyed to an extruder, which converts it into a polystyrene sheet that is wound into rolls. The plastic comes in two forms-clear and black. The rolls are either used immediately to make containers or put into storage. Second, the rolls are loaded onto thermoforming presses, which form the sheet into containers and trim the containers from the sheet. The two manufacturing steps are shown in Figure 7- 119. Step 1 Step 2 Extruder Resin Storage Roll Storage Thermo- forming Press Figure 7-11 Manufacturing Process at SPC Over the past five years, the plastic packaging business has grown steadily. Demand for containers made from clear plastic comes from grocery stores, bakeries, and restaurants. Caterers and grocery stores use the black plastic trays as packaging and serving trays. Demand for clear plastic containers peaks in the summer months, whereas demand for black plastic containers peaks in the fall. Capacity on the extruders is not sufficient to cover demand for sheets during the peak seasons. As a result, the plant is forced to build inventory of each type of sheet in anticipation of future demand. Table 7-4 and Figure 7-12 display historical quarterly demand for each of the two types of containers (clear and black). The team modified SPC's sales data by accounting for lost sales to obtain true demand data. Without the customers involved in this team, SPC would never have known this information, as the company did not keep track of lost orders. 19000 18000 16000 - Black Plastic Demand o Clear Plastic Demand 14000 12000 10000 Demand W 8000 R 6000 4000 2000 0 Year 1 Year 2 Year 3 Year 4 Year 5 Year 6 Figure 7-12 Plot of Quarterly Demand for Clear and Black Plastic Containers na for and black Plastic Container Table 7-4 Quarterly Historical Demand for Clear and Black Plastic Containers Year Quarter Black Plastic Demand (000 lb) Clear Plastic Demand (000 lb) 1 1 2,250 3,200 II 1,737 7,658 III = 2,412 4,420 IV 7,269 2,384 2 1 3,514 3,654 II 2,143 8,680 III 3,459 5,695 IV 7,056 1,953 3 1 4,120 4,742 II 2,766 13,673 III = 2,556 6,640 IV


