

Question: Analyze the two data sets below and determine which type of chart would be appropriate for each of the two data sets. Then create the
Analyze the two data sets below and determine which type of chart would be appropriate for each of the two data sets. Then create the recommended chart using Excel. Once you have created the charts, submit your Excel document with the two data sets and charts.
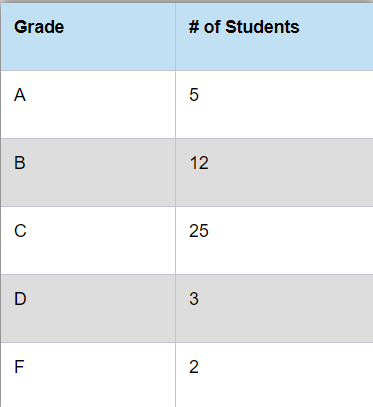
1) The first data set includes test scores for students in a course. For this data set, you should select a chart that will allow breakdown or proportion analysis.
2) The second data set includes sales figures broken down by month over a one-year period. For this data set, you should select a chart that will allow time series analysis.
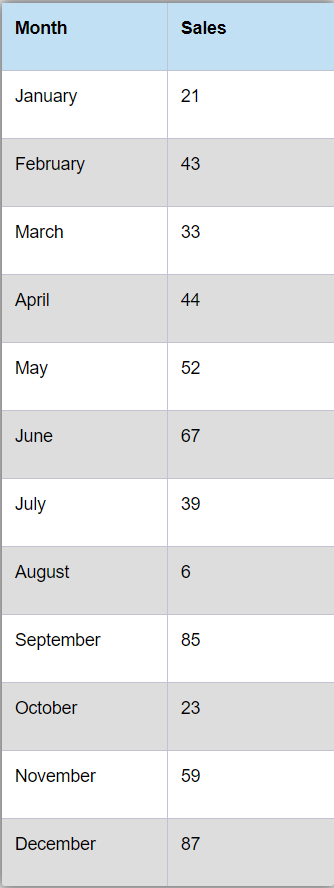
\begin{tabular}{|l|l|} \hline Grade & \# of Students \\ \hline A & 5 \\ \hline B & 12 \\ \hline C & 25 \\ \hline D & 3 \\ \hline F & 2 \\ \hline \end{tabular} Month Sales January 21 February 43 March 33 April 44 \begin{tabular}{l|l} May & 52 \\ \hline \end{tabular} June 67 July 39 August 6 \begin{tabular}{l|l} September & 85 \\ \hline \end{tabular} \begin{tabular}{l|l} October & 23 \end{tabular} November 59 December 87
Step by Step Solution
There are 3 Steps involved in it

Get step-by-step solutions from verified subject matter experts