Question: Version - Applied Analytics Part 4 Step 1: Import the data Connect to the Excel file. Business Analytics Tableau Lab Quiz. There is just one
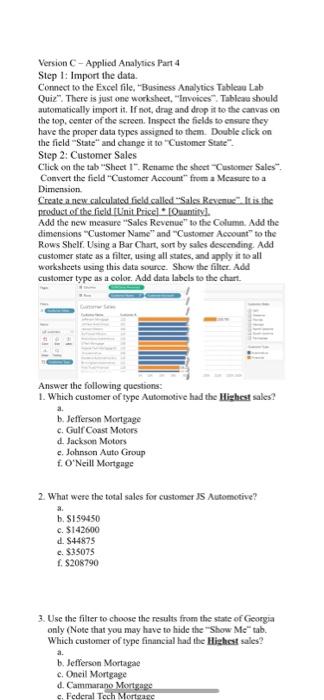
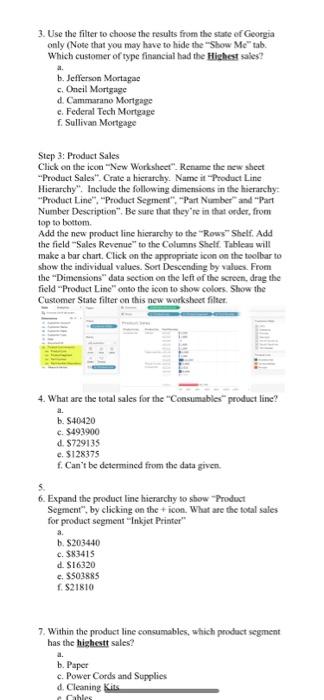
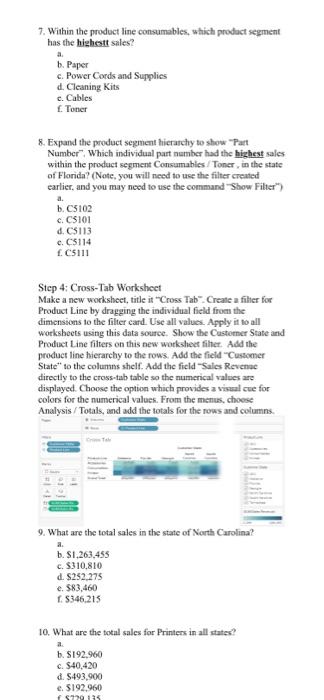
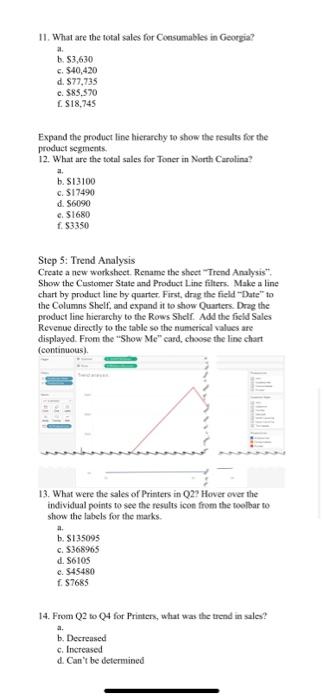
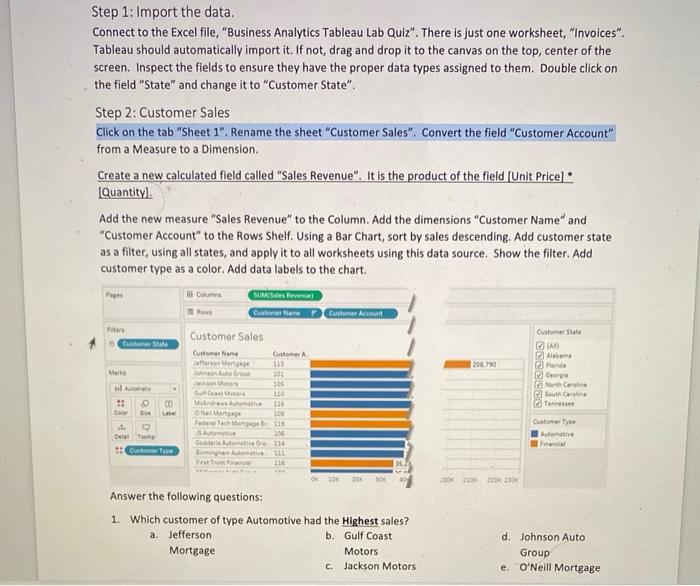
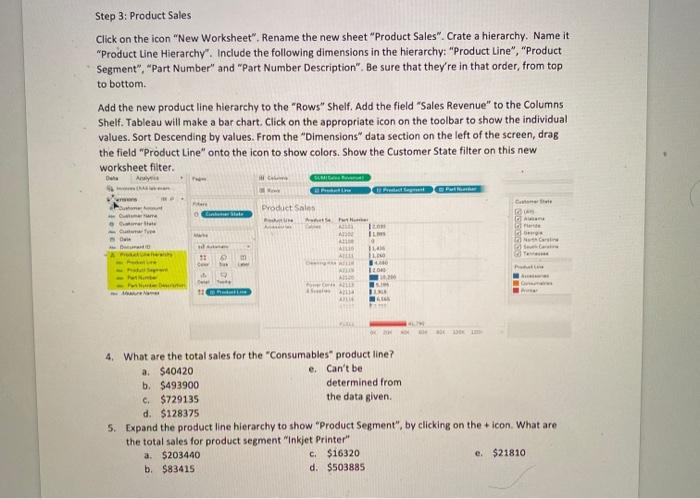
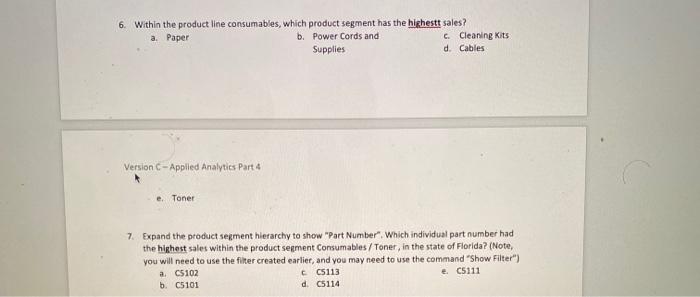
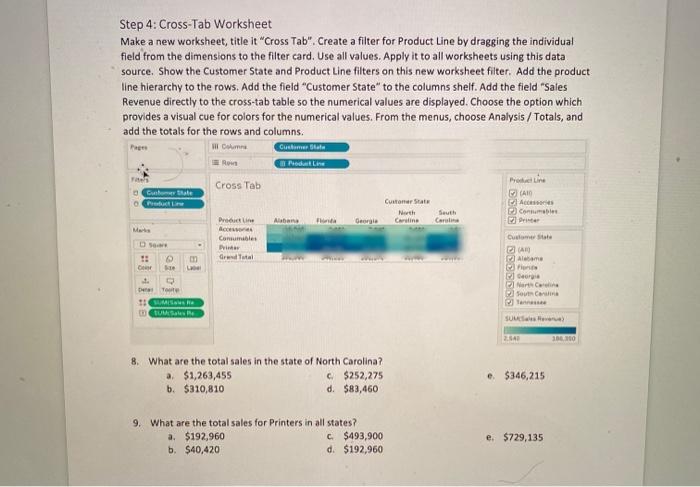
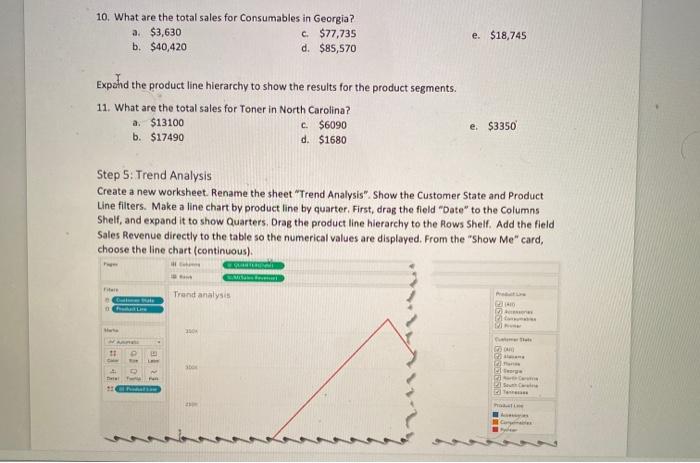
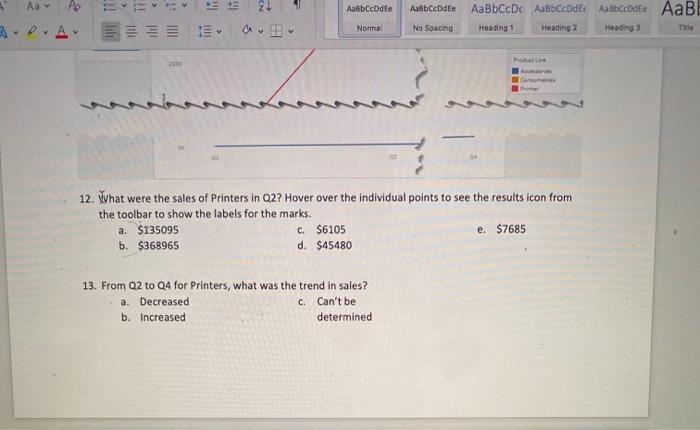
Version - Applied Analytics Part 4 Step 1: Import the data Connect to the Excel file. "Business Analytics Tableau Lab Quiz". There is just one worksheet, "invoices Tables should automatically import it. If not, drag and drop it to the canvas on the top, center of the screen. Inspect the fields to ensure they have the proper data types assigned to them. Double click on the field "State" and change it to "Customer State". Step 2: Customer Sales Click on the tab "Sheet 1". Retiame the sheet Customer Sales Convert the field "Customer Account from a Measure to a Dimension Create a new.calculated field called Sales Res. It is ths product of the field Unit Price] Ouantity] Add the new measure Sales Revenue to the Column. Add the dimensions "Customer Name" and "Customer Account to the Rows Shell. Using a Bar Chart, sort by sales descending. Add customer state as a filter, using all states, and apply it to all worksheets using this data source. Show the filter. Add customer type as a colot. Add data labels to the chart. Answer the following questions: 1. Which customer of type Automotive had the Highest sales? b. Jefferson Mortgage c. Gulf Coast Motors d. Jackson Motors c. Johnson Auto Group f. O'Neill Mortgage 2. What were the total sales for customers Automotive? a. h. S159450 c. $142600 d. 844875 c. $35075 f. $208790 3. Use the filter to choose the results from the state of Georgia only (Note that you may have to hide the Show Metab. Which customer of type financial had the Highest sales? b. Jefferson Mortage c. Oneil Mortgage d. Cammarano Mortgage c. Federal Tech Mortare a. 3. Use the filter to choose the results from the state of Georgia only (Note that you may have to hide the "Show Me" tab. Which customer of type financial had the Highest sales? b. Jefferson Mortage c. Oneil Mortgage d. Cammarano Mortgage e Federal Tech Mortgage f. Sullivan Mortgage Step 3: Product Sales Click on the icon "New Worksheet". Rename the new sheet Product Sales". Crate a hierarchy. Name it Product Line Hierarchy". Include the following dimensions in the hierarchy Product Line", "Product Segment". -Part Number" and "Part Number Description". Be sure that they're in that order, from top to bottom Add the new product line hierarchy to the "Rows" Shelf. Add the field Sales Revenue to the Columns Shelf Tableas will make a bar chart, Click on the appropriate icon on the toolbar to show the individual values. Sort Descending by values. From the "Dimensions data section on the left of the screen, drag the field Product Line" onto the icon to show colors. Show the Customer State filter on this new worksheet filser. 4. What are the total sales for the Consumables product line? a. b. S40420 c. $493900 d. 8729135 e. $128375 f. Can't be determined from the data given 6. Expand the product line hierarchy to show Product Segment", by clicking on the icon. What are the total sales for product segment "Inkjet Printer b. S203440 c. $83415 d. S16320 c. 5503885 f. $21810 7. Within the product line consumables, which product segment has the highest sales? b. Paper c. Power Cords and Supplies d. Cleaning Kits ahles 7. Within the product line consumables, which product segment has the highest sales? a b. Paper c. Power Cords and Supplies d. Cleaning Kits c. Cables 1. Toner 8. Expand the product segment hierarchy to show Part Number". Which individual part number had the highest sales within the product segment Consumables / Toner, in the state of Florida? (Note, you will need to use the filter created carlier, and you may need to use the command "Show Filter) b. C5102 c. CS101 d. CS113 e. C5114 f. 5111 Step 4: Cross-Tab Worksheet Make a new worksheet, title it "Cross Tab. Create a filter for Product Line by dragging the individual field from the dimensions to the filter card. Use all values. Apply it to all worksheets using this data source. Show the Customer State and Product Line filters on this new worksheet fiher. Add the product line hierarchy to the rows. Add the field "Customer State to the columns shelf. Add the field Sales Revenue directly to the cross-tab table so the numerical values are displayed. Choose the option which provides a visual cue for colors for the numerical values. From the menus, choose Analysis / Totals, and add the totals for the rows and columns a. 9. What are the total sales in the state of North Carolina? b. S1.263,455 c. $310.810 d. S252.275 e. $83,460 S346.215 10. What are the total sales for Printers in all statex? b. S192.960 c. $40,420 d. $493,900 e. $192,960 2011 11. What are the total sales for Consumables in Georgia? a. b. 53,630 c. $40,420 d. 877,735 c. $85.570 S18,745 Expand the product line hierarchy to show the results for the product segments 12. What are the total sales for Toner in North Carolina? a. b. S13100 CS17490 d. 56090 c. $1680 f. $3350 Step 5: Trend Analysis Create a new worksheet. Rename the sheet Trend Analysis". Show the Customer State and Product Line filters. Make a line chart by product line by quarter. First, drag the field Date" to the Columns Shelf, and expand it to show Quarters. Drag the product line hierarchy to the Rows Shelf. Add the field Sales Revenue directly to the table so the numerical values are displayed. From the "Show Me" card, choose the line chart (continuous) 13. What were the sales of Printers in Q2? Hover over the individual points to see the results icon from the toolbar to show the labels for the marks a b. S135095 c. $368965 d. 86105 c. 545480 187685 14. From Q2 to Q4 for Printers, what was the trend in sales? a. b. Decreased c. Increased d. Can't be determined Step 6: Advanced Questions EXTRA CREDIT In the next set of questions, you will need to determine the type of chart to make to answer the question. There may be more than one way to get to the answer! 15. Expand the product line hierarchy on the Trend Analysis worksheet to show the product segments. What were the sales of Paper in 3? a $50,830 b. $22,030 c. $89,578 d. 87,455 e. $46,290 16. Which state had no sales for customers of type Financial? a Alabama b. Florida c. Georgia d. North Carolina e. South Carolina 17. What individual part number hand the highest quantity of items sold, in the state of Florida? (Note, not sales revenue but quantity) a. PIOS b. C5110 c. C5103 d. P1307 e. CS108 Create a new calculated field, titled profit. The formula is [Sales Revenue) - Quantity]*(Unit Cost) 18. Which state had the highest overall profit? a. Georgia b. Florida c. South Carolina d. Alabama e. Tenessee 19. In the state of Florica, which product segment returned the most profit. a. Paper b. Toner c. Dot Matrix Printers d. Laser Printers c. Printer Ribbon 20. In the state of Georgia, what was the profit from the sales of Paper? a $77962 b. S115284 c. $233391 d. $11918 c. $37321 21. Which month had the highest profit? a. January b. March c. May d. July Step 1: Import the data. Connect to the Excel file, "Business Analytics Tableau Lab Quiz". There is just one worksheet, "Invoices". Tableau should automatically import it. If not, drag and drop it to the canvas on the top, center of the screen. Inspect the fields to ensure they have the proper data types assigned to them. Double click on the field "State and change it to "Customer State". Step 2: Customer Sales Click on the tab "Sheet 1". Rename the sheet "Customer Sales". Convert the field "Customer Account" from a Measure to a Dimension Create a new calculated field called "Sales Revenue". It is the product of the field (Unit Pricel : Quantityl. Add the new measure "Sales Revenue" to the Column. Add the dimensions "Customer Name" and "Customer Account to the Rows Shelf. Using a Bar Chart, sort by sales descending. Add customer state as a filter, using all states, and apply it to all worksheets using this data source. Show the filter. Add customer type as a color. Add data labels to the chart. Columns Now SUM Sesve Cuslim Nome Customer coun Customer Sale Customer Sales Custom Sale Comer Name Alabama 2007 201 105 110 116 101 PNC SC 1: an O Morte Customer Type Autente Steve 106 114 Beste Itaca 310 ok 10 20 30 Answer the following questions: 1. Which customer of type Automotive had the Highest sales? a. Jefferson b. Gulf Coast Mortgage Motors c. Jackson Motors d. Johnson Auto Group e. O'Neill Mortgage Answer the following questions: 1. Which customer of type Automotive had the Highest sales? a. Jefferson b. Gulf Coast Mortgage Motors c. Jackson Motors d. Johnson Auto Group e O'Neill Mortgage 2. What were the total sales for customer JS Automotive? $159450 c. $44875 b. $142600 d. $35075 a e $208790 Version - Applied Analytics Part 4 3. Use the filter to choose the results from the state of Georgia only (Note that you may have to hide the "Show Me" tab. Which customer of type financial had the Highest sales? a. Jefferson C. Cammarang e. Sullivan Mortaras Mortgage Mortgage b. Oneil Mortgage d. Federal Tech Mortgage Step 3: Product Sales Click on the icon "New Worksheet". Rename the new sheet "Product Sales". Crate a hierarchy. Name it "Product Line Hierarchy". Include the following dimensions in the hierarchy: "Product Line", "Product Segment", "Part Number" and "Part Number Description". Be sure that they're in that order, from top to bottom Add the new product line hierarchy to the "Rows" Shelf. Add the field Sales Revenue" to the Columns Shelf. Tableau will make a bar chart. Click on the appropriate icon on the toolbar to show the individual values. Sort Descending by values. From the "Dimensions data section on the left of the screen, drag the field "Product Line" onto the icon to show colors. Show the Customer State filter on this new worksheet filter De Aye Product Sales La State Full A SNC 17 m IL AN ID - 4. What are the total sales for the "Consumables" product line? a $40420 e. Can't be b. $493900 determined from c. $729135 the data given d. $128375 5. Expand the product line hierarchy to show "Product Segment", by clicking on the icon. What are the total sales for product segment "Inkjet Printer a $203440 c. $16320 e. $21810 b. $83415 d. $503885 6. Within the product line consumables, which product segment has the highest sales? a Paper b. Power Cords and c. Cleaning Kits Supplies d. Cables Version - Applied Analytics Part 4 e. Toner 7 Expand the product segment hierarchy to show "Part Number". Which individual part number had the highest sales within the product segment Consumables / Toner, in the state of Florida? (Note, you will need to use the filter created earlier, and you may need to use the command "Show Filter") a C5102 C05113 e C5111 b. C5101 d. 05114 Step 4: Cross-Tab Worksheet Make a new worksheet, title it "Cross Tab". Create a filter for Product Line by dragging the individual field from the dimensions to the filter card. Use all values. Apply it to all worksheets using this data source. Show the Customer State and Product Line filters on this new worksheet filter. Add the product line hierarchy to the rows. Add the field "Customer State" to the columns shelf. Add the field "Sales Revenue directly to the cross-tab table so the numerical values are displayed. Choose the option which provides a visual cue for colors for the numerical values. From the menus, choose Analysis / Totals, and add the totals for the rows and columns Customer satu Rous Produle Pages Il Come Cross Tab Guate Cu State Seth Car AID ElA Com Mats Product co Committee P Grd Total Custom State GAR Alabama re ge INC South De TUS SUU 26 18 8. What are the total sales in the state of North Carolina? a $1,263,455 c$252,275 b. $310,810 d. $83,460 e $346,215 9. What are the total sales for Printers in all states? a. $192,960 $493,900 b. $40,420 d. $192,960 e. $729,135 10. What are the total sales for Consumables in Georgia? a $3,630 c. $77,735 b. $40,420 d. $85,570 e. $18,745 Expand the product line hierarchy to show the results for the product segments. 11. What are the total sales for Toner in North Carolina? a. $13100 c. $6090 b. $17490 d. $1680 e. $3350 Step 5: Trend Analysis Create a new worksheet. Rename the sheet "Trend Analysis". Show the Customer State and Product Line filters. Make a line chart by product line by quarter. First, drag the field "Date" to the Columns Shelf, and expand it to show Quarters, Drag the product line hierarchy to the Rows Shelf. Add the field Sales Revenue directly to the table so the numerical values are displayed. From the "Show Me" card, choose the line chart (continuous). Trend analysis 10 20 11 BE Aa > PS 2 AaBbCcDdEe Abbcode AaBbCcDc AaBbcode AaBtCode AaB Av Normal No Spacing Heading 1 Heading 2 Tinde Heading 3 01 12. What were the sales of Printers in Q2? Hover over the individual points to see the results icon from the toolbar to show the labels for the marks. a. $135095 C. $6105 e. $7685 b. $368965 d. $45480 13. From Q2 to Q4 for Printers, what was the trend in sales? a. Decreased c. Can't be b. Increased determined Step 6: Advanced Questions EXTRA CREDIT In the next set of questions, you will need to determine the type of chart to make to answer the question. There may be more than one way to get to the answer! 14. Expand the product line hierarchy on the Trend Analysis worksheet to show the product segments. What were the sales of Paper in Q3? a. $50,830 b. $22,030 I c. $89,578 d. $7,455 e. $46,290 15. Which state had no sales for customers of type Financial? a. Alabama b. Florida c. Georgia d. North Carolina e. South Carolina 16. What individual part number had the highest quantity of items sold, in the state of Florida? (Note, not sales revenue, but quantity). a. P1105 b C5110 C. CS103 d P1307 e. C5108 Create a new calculated field, titled profit. The formula is (Sales Revenue) - IQuantity]*[Unit Cost). 17. Which state had the highest overall profit? a. Georgia b. Florida c. South Carolina I Version - Applied Analytics Part 4 d. Alabama e. Tenessee 18. In the state of Florida, which product segment returned the most profit. a. Paper b. Toner C Dot Matrix Printers d. Laser Printers Printer Ribbon e. 19. In the state of Georgia, what was the profit from the sales of Paper? a. $77962 b $115284 c. $233391 d$11918 20. Which month had the highest profit? I a. January b. March C. May d. July e. September Version - Applied Analytics Part 4 Step 1: Import the data Connect to the Excel file. "Business Analytics Tableau Lab Quiz". There is just one worksheet, "invoices Tables should automatically import it. If not, drag and drop it to the canvas on the top, center of the screen. Inspect the fields to ensure they have the proper data types assigned to them. Double click on the field "State" and change it to "Customer State". Step 2: Customer Sales Click on the tab "Sheet 1". Retiame the sheet Customer Sales Convert the field "Customer Account from a Measure to a Dimension Create a new.calculated field called Sales Res. It is ths product of the field Unit Price] Ouantity] Add the new measure Sales Revenue to the Column. Add the dimensions "Customer Name" and "Customer Account to the Rows Shell. Using a Bar Chart, sort by sales descending. Add customer state as a filter, using all states, and apply it to all worksheets using this data source. Show the filter. Add customer type as a colot. Add data labels to the chart. Answer the following questions: 1. Which customer of type Automotive had the Highest sales? b. Jefferson Mortgage c. Gulf Coast Motors d. Jackson Motors c. Johnson Auto Group f. O'Neill Mortgage 2. What were the total sales for customers Automotive? a. h. S159450 c. $142600 d. 844875 c. $35075 f. $208790 3. Use the filter to choose the results from the state of Georgia only (Note that you may have to hide the Show Metab. Which customer of type financial had the Highest sales? b. Jefferson Mortage c. Oneil Mortgage d. Cammarano Mortgage c. Federal Tech Mortare a. 3. Use the filter to choose the results from the state of Georgia only (Note that you may have to hide the "Show Me" tab. Which customer of type financial had the Highest sales? b. Jefferson Mortage c. Oneil Mortgage d. Cammarano Mortgage e Federal Tech Mortgage f. Sullivan Mortgage Step 3: Product Sales Click on the icon "New Worksheet". Rename the new sheet Product Sales". Crate a hierarchy. Name it Product Line Hierarchy". Include the following dimensions in the hierarchy Product Line", "Product Segment". -Part Number" and "Part Number Description". Be sure that they're in that order, from top to bottom Add the new product line hierarchy to the "Rows" Shelf. Add the field Sales Revenue to the Columns Shelf Tableas will make a bar chart, Click on the appropriate icon on the toolbar to show the individual values. Sort Descending by values. From the "Dimensions data section on the left of the screen, drag the field Product Line" onto the icon to show colors. Show the Customer State filter on this new worksheet filser. 4. What are the total sales for the Consumables product line? a. b. S40420 c. $493900 d. 8729135 e. $128375 f. Can't be determined from the data given 6. Expand the product line hierarchy to show Product Segment", by clicking on the icon. What are the total sales for product segment "Inkjet Printer b. S203440 c. $83415 d. S16320 c. 5503885 f. $21810 7. Within the product line consumables, which product segment has the highest sales? b. Paper c. Power Cords and Supplies d. Cleaning Kits ahles 7. Within the product line consumables, which product segment has the highest sales? a b. Paper c. Power Cords and Supplies d. Cleaning Kits c. Cables 1. Toner 8. Expand the product segment hierarchy to show Part Number". Which individual part number had the highest sales within the product segment Consumables / Toner, in the state of Florida? (Note, you will need to use the filter created carlier, and you may need to use the command "Show Filter) b. C5102 c. CS101 d. CS113 e. C5114 f. 5111 Step 4: Cross-Tab Worksheet Make a new worksheet, title it "Cross Tab. Create a filter for Product Line by dragging the individual field from the dimensions to the filter card. Use all values. Apply it to all worksheets using this data source. Show the Customer State and Product Line filters on this new worksheet fiher. Add the product line hierarchy to the rows. Add the field "Customer State to the columns shelf. Add the field Sales Revenue directly to the cross-tab table so the numerical values are displayed. Choose the option which provides a visual cue for colors for the numerical values. From the menus, choose Analysis / Totals, and add the totals for the rows and columns a. 9. What are the total sales in the state of North Carolina? b. S1.263,455 c. $310.810 d. S252.275 e. $83,460 S346.215 10. What are the total sales for Printers in all statex? b. S192.960 c. $40,420 d. $493,900 e. $192,960 2011 11. What are the total sales for Consumables in Georgia? a. b. 53,630 c. $40,420 d. 877,735 c. $85.570 S18,745 Expand the product line hierarchy to show the results for the product segments 12. What are the total sales for Toner in North Carolina? a. b. S13100 CS17490 d. 56090 c. $1680 f. $3350 Step 5: Trend Analysis Create a new worksheet. Rename the sheet Trend Analysis". Show the Customer State and Product Line filters. Make a line chart by product line by quarter. First, drag the field Date" to the Columns Shelf, and expand it to show Quarters. Drag the product line hierarchy to the Rows Shelf. Add the field Sales Revenue directly to the table so the numerical values are displayed. From the "Show Me" card, choose the line chart (continuous) 13. What were the sales of Printers in Q2? Hover over the individual points to see the results icon from the toolbar to show the labels for the marks a b. S135095 c. $368965 d. 86105 c. 545480 187685 14. From Q2 to Q4 for Printers, what was the trend in sales? a. b. Decreased c. Increased d. Can't be determined Step 6: Advanced Questions EXTRA CREDIT In the next set of questions, you will need to determine the type of chart to make to answer the question. There may be more than one way to get to the answer! 15. Expand the product line hierarchy on the Trend Analysis worksheet to show the product segments. What were the sales of Paper in 3? a $50,830 b. $22,030 c. $89,578 d. 87,455 e. $46,290 16. Which state had no sales for customers of type Financial? a Alabama b. Florida c. Georgia d. North Carolina e. South Carolina 17. What individual part number hand the highest quantity of items sold, in the state of Florida? (Note, not sales revenue but quantity) a. PIOS b. C5110 c. C5103 d. P1307 e. CS108 Create a new calculated field, titled profit. The formula is [Sales Revenue) - Quantity]*(Unit Cost) 18. Which state had the highest overall profit? a. Georgia b. Florida c. South Carolina d. Alabama e. Tenessee 19. In the state of Florica, which product segment returned the most profit. a. Paper b. Toner c. Dot Matrix Printers d. Laser Printers c. Printer Ribbon 20. In the state of Georgia, what was the profit from the sales of Paper? a $77962 b. S115284 c. $233391 d. $11918 c. $37321 21. Which month had the highest profit? a. January b. March c. May d. July Step 1: Import the data. Connect to the Excel file, "Business Analytics Tableau Lab Quiz". There is just one worksheet, "Invoices". Tableau should automatically import it. If not, drag and drop it to the canvas on the top, center of the screen. Inspect the fields to ensure they have the proper data types assigned to them. Double click on the field "State and change it to "Customer State". Step 2: Customer Sales Click on the tab "Sheet 1". Rename the sheet "Customer Sales". Convert the field "Customer Account" from a Measure to a Dimension Create a new calculated field called "Sales Revenue". It is the product of the field (Unit Pricel : Quantityl. Add the new measure "Sales Revenue" to the Column. Add the dimensions "Customer Name" and "Customer Account to the Rows Shelf. Using a Bar Chart, sort by sales descending. Add customer state as a filter, using all states, and apply it to all worksheets using this data source. Show the filter. Add customer type as a color. Add data labels to the chart. Columns Now SUM Sesve Cuslim Nome Customer coun Customer Sale Customer Sales Custom Sale Comer Name Alabama 2007 201 105 110 116 101 PNC SC 1: an O Morte Customer Type Autente Steve 106 114 Beste Itaca 310 ok 10 20 30 Answer the following questions: 1. Which customer of type Automotive had the Highest sales? a. Jefferson b. Gulf Coast Mortgage Motors c. Jackson Motors d. Johnson Auto Group e. O'Neill Mortgage Answer the following questions: 1. Which customer of type Automotive had the Highest sales? a. Jefferson b. Gulf Coast Mortgage Motors c. Jackson Motors d. Johnson Auto Group e O'Neill Mortgage 2. What were the total sales for customer JS Automotive? $159450 c. $44875 b. $142600 d. $35075 a e $208790 Version - Applied Analytics Part 4 3. Use the filter to choose the results from the state of Georgia only (Note that you may have to hide the "Show Me" tab. Which customer of type financial had the Highest sales? a. Jefferson C. Cammarang e. Sullivan Mortaras Mortgage Mortgage b. Oneil Mortgage d. Federal Tech Mortgage Step 3: Product Sales Click on the icon "New Worksheet". Rename the new sheet "Product Sales". Crate a hierarchy. Name it "Product Line Hierarchy". Include the following dimensions in the hierarchy: "Product Line", "Product Segment", "Part Number" and "Part Number Description". Be sure that they're in that order, from top to bottom Add the new product line hierarchy to the "Rows" Shelf. Add the field Sales Revenue" to the Columns Shelf. Tableau will make a bar chart. Click on the appropriate icon on the toolbar to show the individual values. Sort Descending by values. From the "Dimensions data section on the left of the screen, drag the field "Product Line" onto the icon to show colors. Show the Customer State filter on this new worksheet filter De Aye Product Sales La State Full A SNC 17 m IL AN ID - 4. What are the total sales for the "Consumables" product line? a $40420 e. Can't be b. $493900 determined from c. $729135 the data given d. $128375 5. Expand the product line hierarchy to show "Product Segment", by clicking on the icon. What are the total sales for product segment "Inkjet Printer a $203440 c. $16320 e. $21810 b. $83415 d. $503885 6. Within the product line consumables, which product segment has the highest sales? a Paper b. Power Cords and c. Cleaning Kits Supplies d. Cables Version - Applied Analytics Part 4 e. Toner 7 Expand the product segment hierarchy to show "Part Number". Which individual part number had the highest sales within the product segment Consumables / Toner, in the state of Florida? (Note, you will need to use the filter created earlier, and you may need to use the command "Show Filter") a C5102 C05113 e C5111 b. C5101 d. 05114 Step 4: Cross-Tab Worksheet Make a new worksheet, title it "Cross Tab". Create a filter for Product Line by dragging the individual field from the dimensions to the filter card. Use all values. Apply it to all worksheets using this data source. Show the Customer State and Product Line filters on this new worksheet filter. Add the product line hierarchy to the rows. Add the field "Customer State" to the columns shelf. Add the field "Sales Revenue directly to the cross-tab table so the numerical values are displayed. Choose the option which provides a visual cue for colors for the numerical values. From the menus, choose Analysis / Totals, and add the totals for the rows and columns Customer satu Rous Produle Pages Il Come Cross Tab Guate Cu State Seth Car AID ElA Com Mats Product co Committee P Grd Total Custom State GAR Alabama re ge INC South De TUS SUU 26 18 8. What are the total sales in the state of North Carolina? a $1,263,455 c$252,275 b. $310,810 d. $83,460 e $346,215 9. What are the total sales for Printers in all states? a. $192,960 $493,900 b. $40,420 d. $192,960 e. $729,135 10. What are the total sales for Consumables in Georgia? a $3,630 c. $77,735 b. $40,420 d. $85,570 e. $18,745 Expand the product line hierarchy to show the results for the product segments. 11. What are the total sales for Toner in North Carolina? a. $13100 c. $6090 b. $17490 d. $1680 e. $3350 Step 5: Trend Analysis Create a new worksheet. Rename the sheet "Trend Analysis". Show the Customer State and Product Line filters. Make a line chart by product line by quarter. First, drag the field "Date" to the Columns Shelf, and expand it to show Quarters, Drag the product line hierarchy to the Rows Shelf. Add the field Sales Revenue directly to the table so the numerical values are displayed. From the "Show Me" card, choose the line chart (continuous). Trend analysis 10 20 11 BE Aa > PS 2 AaBbCcDdEe Abbcode AaBbCcDc AaBbcode AaBtCode AaB Av Normal No Spacing Heading 1 Heading 2 Tinde Heading 3 01 12. What were the sales of Printers in Q2? Hover over the individual points to see the results icon from the toolbar to show the labels for the marks. a. $135095 C. $6105 e. $7685 b. $368965 d. $45480 13. From Q2 to Q4 for Printers, what was the trend in sales? a. Decreased c. Can't be b. Increased determined Step 6: Advanced Questions EXTRA CREDIT In the next set of questions, you will need to determine the type of chart to make to answer the question. There may be more than one way to get to the answer! 14. Expand the product line hierarchy on the Trend Analysis worksheet to show the product segments. What were the sales of Paper in Q3? a. $50,830 b. $22,030 I c. $89,578 d. $7,455 e. $46,290 15. Which state had no sales for customers of type Financial? a. Alabama b. Florida c. Georgia d. North Carolina e. South Carolina 16. What individual part number had the highest quantity of items sold, in the state of Florida? (Note, not sales revenue, but quantity). a. P1105 b C5110 C. CS103 d P1307 e. C5108 Create a new calculated field, titled profit. The formula is (Sales Revenue) - IQuantity]*[Unit Cost). 17. Which state had the highest overall profit? a. Georgia b. Florida c. South Carolina I Version - Applied Analytics Part 4 d. Alabama e. Tenessee 18. In the state of Florida, which product segment returned the most profit. a. Paper b. Toner C Dot Matrix Printers d. Laser Printers Printer Ribbon e. 19. In the state of Georgia, what was the profit from the sales of Paper? a. $77962 b $115284 c. $233391 d$11918 20. Which month had the highest profit? I a. January b. March C. May d. July e. September