

Question: analyze the volatility of the graph given below. Standard deviation of daily returns 5 10 15 0 Bitcoin Volatility Time Series Charts Zoom 1m 3m
analyze the volatility of the graph given below. 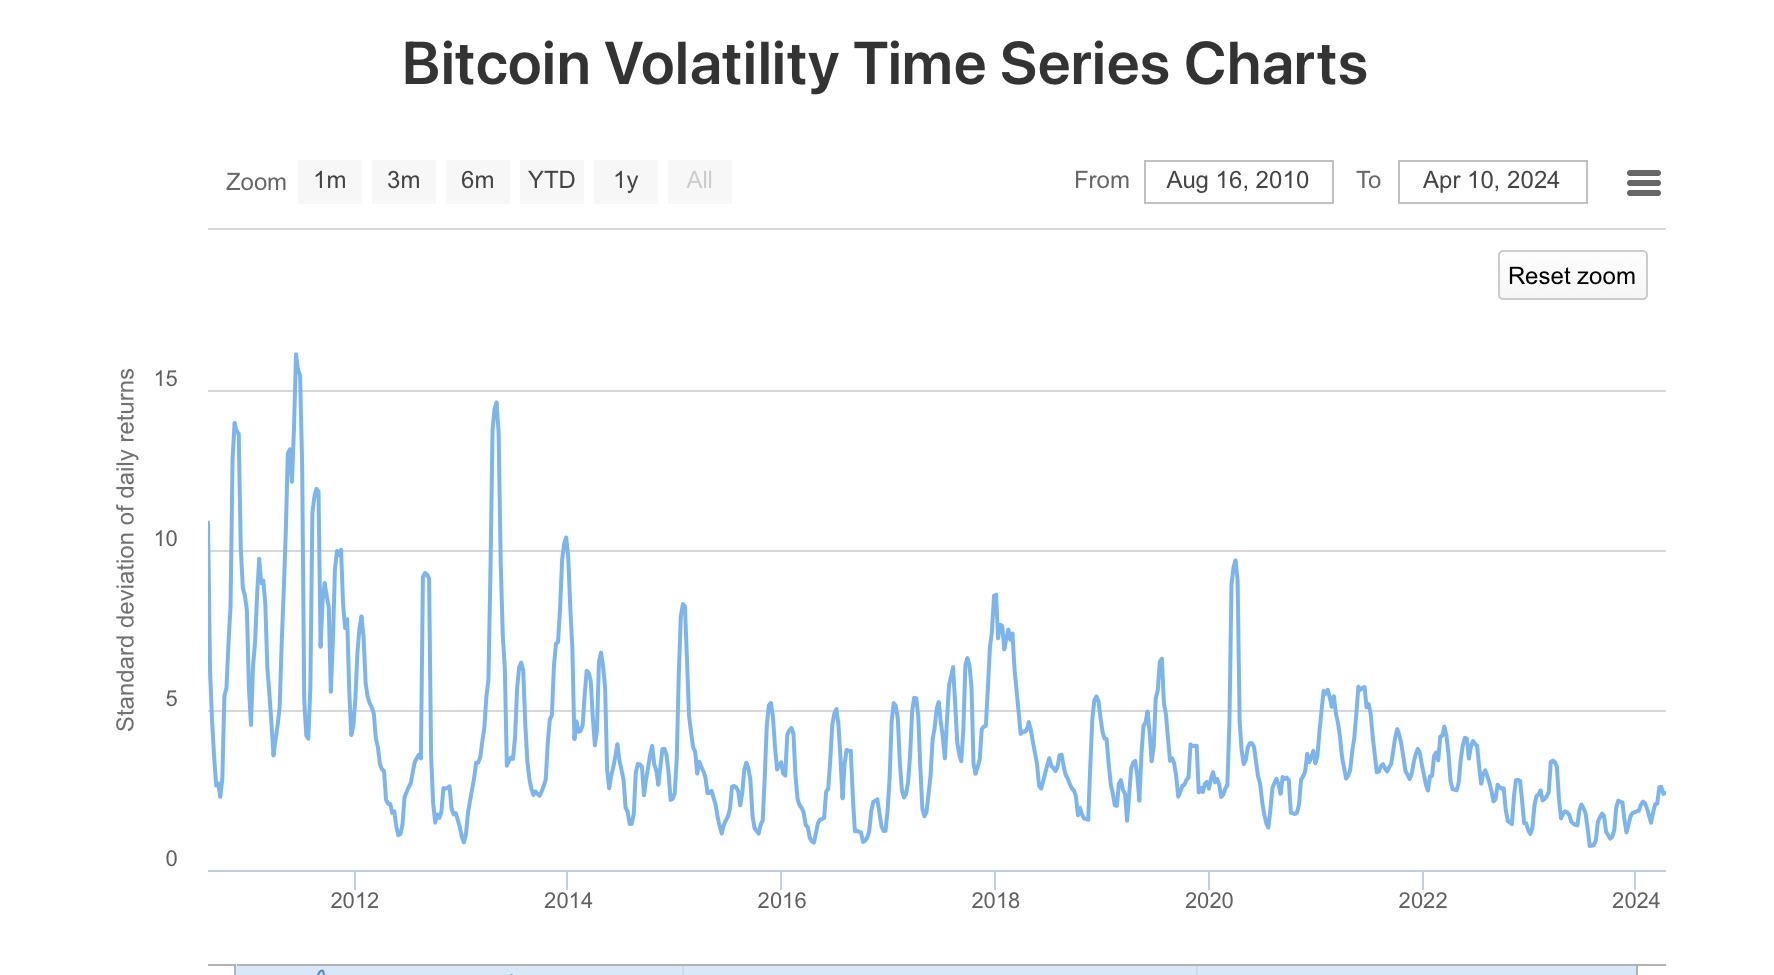
Standard deviation of daily returns 5 10 15 0 Bitcoin Volatility Time Series Charts Zoom 1m 3m 6m YTD 1y All From Aug 16, 2010 Apr 10, 2024 Reset zoom 2012 2014 2016 2018 2020 2022 2024
Step by Step Solution
There are 3 Steps involved in it
1 Expert Approved Answer
Step: 1 Unlock

Question Has Been Solved by an Expert!
Get step-by-step solutions from verified subject matter experts
Step: 2 Unlock
Step: 3 Unlock