

Question: ANALYZE USING TREE DIAGRAM: *Make answer clear please* A Firm plans to expand its product line must decide whether to build a small or a
ANALYZE USING TREE DIAGRAM: 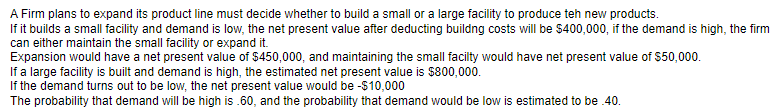
*Make answer clear please*
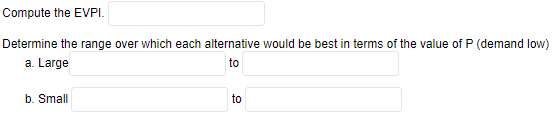
A Firm plans to expand its product line must decide whether to build a small or a large facility to produce teh new products. If it builds a small facility and demand is low, the net present value after deducting buildng costs will be $400,000, if the demand is high, the firm can either maintain the small facility or expand it Expansion would have a net present value of $450,000, and maintaining the small facilty would have net present value of $50,000. If a large facility is built and demand is high, the estimated net present value is $800,000. If the demand turns out to be low, the net present value would be - $10,000 The probability that demand will be high is .60, and the probability that demand would be low is estimated to be 40. Compute the EVPI. Determine the range over which each alternative would be best in terms of the value of P (demand low) a. Large to b. Small toStep by Step Solution
There are 3 Steps involved in it
1 Expert Approved Answer
Step: 1 Unlock

Question Has Been Solved by an Expert!
Get step-by-step solutions from verified subject matter experts
Step: 2 Unlock
Step: 3 Unlock