

Question: Analyzing Financial Risk Presented below are summary financial data from the Coca-Cola Enterprises, Inc., annual report. Using the ratio definitions from Exhibit 4.6, calculate the
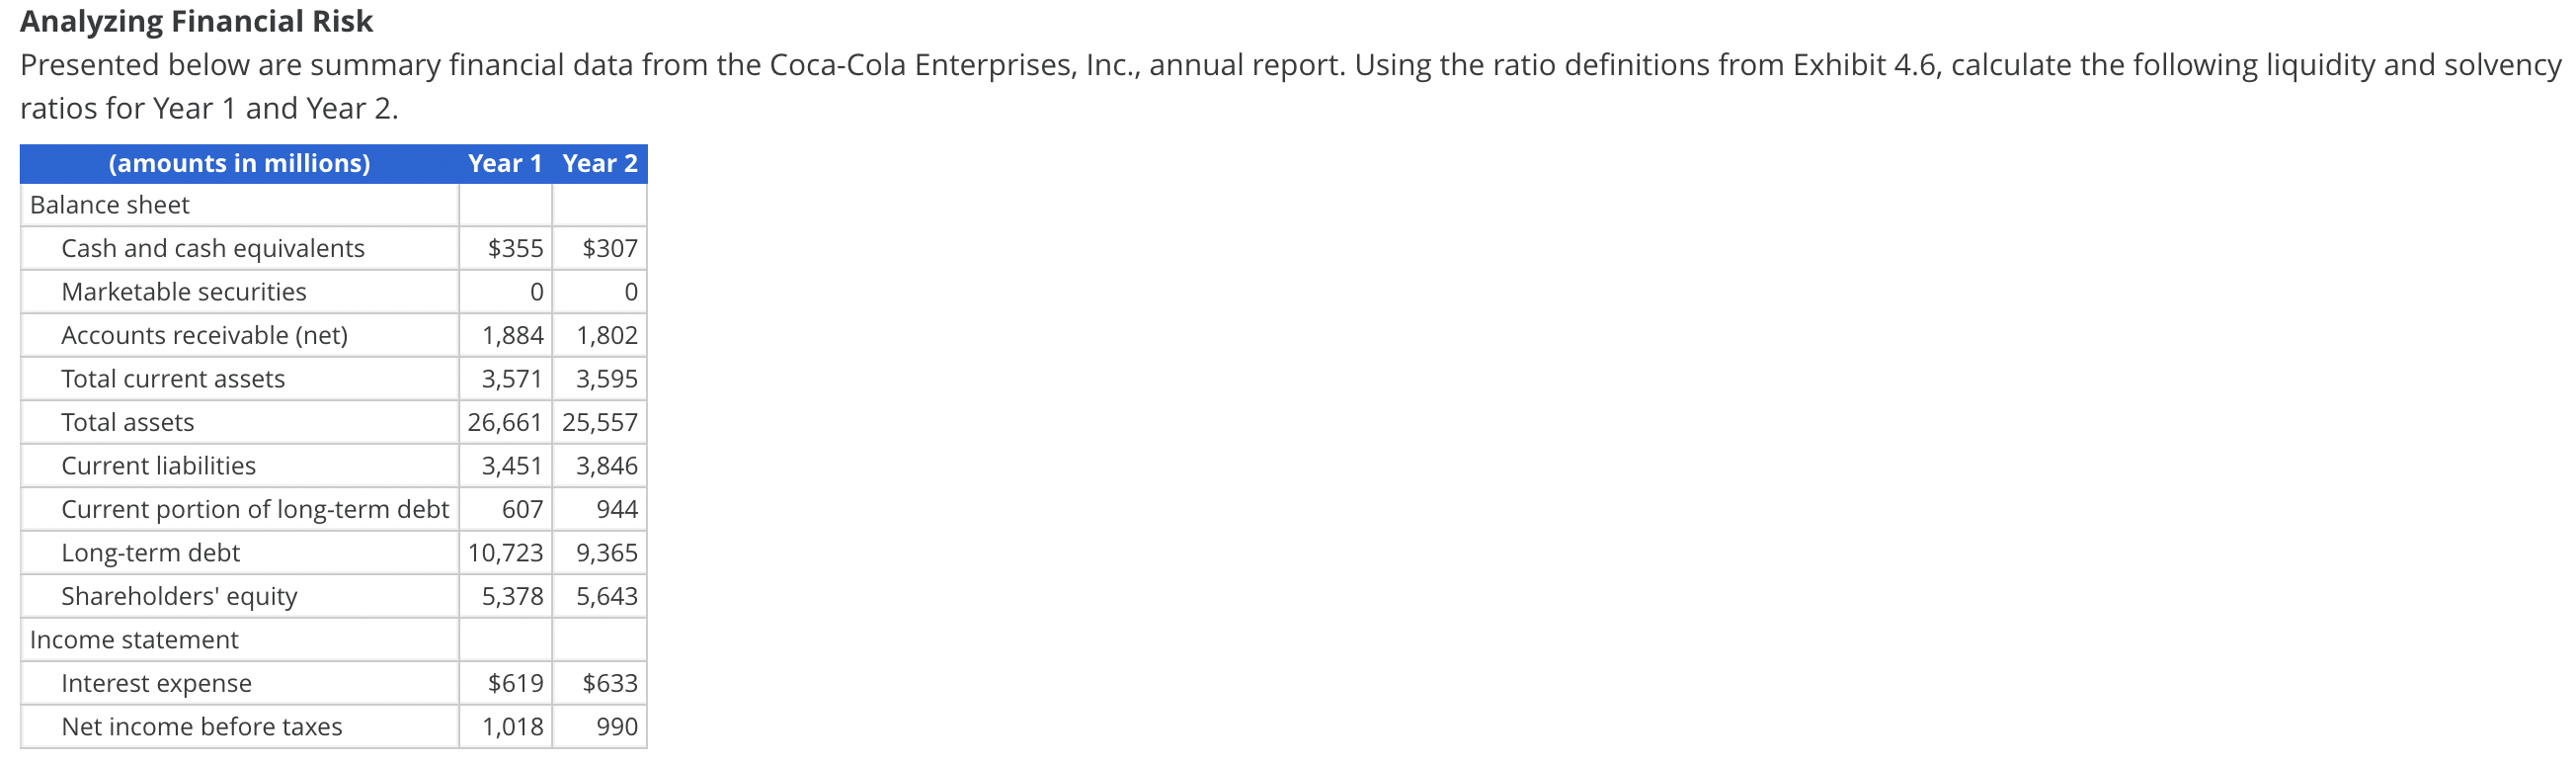
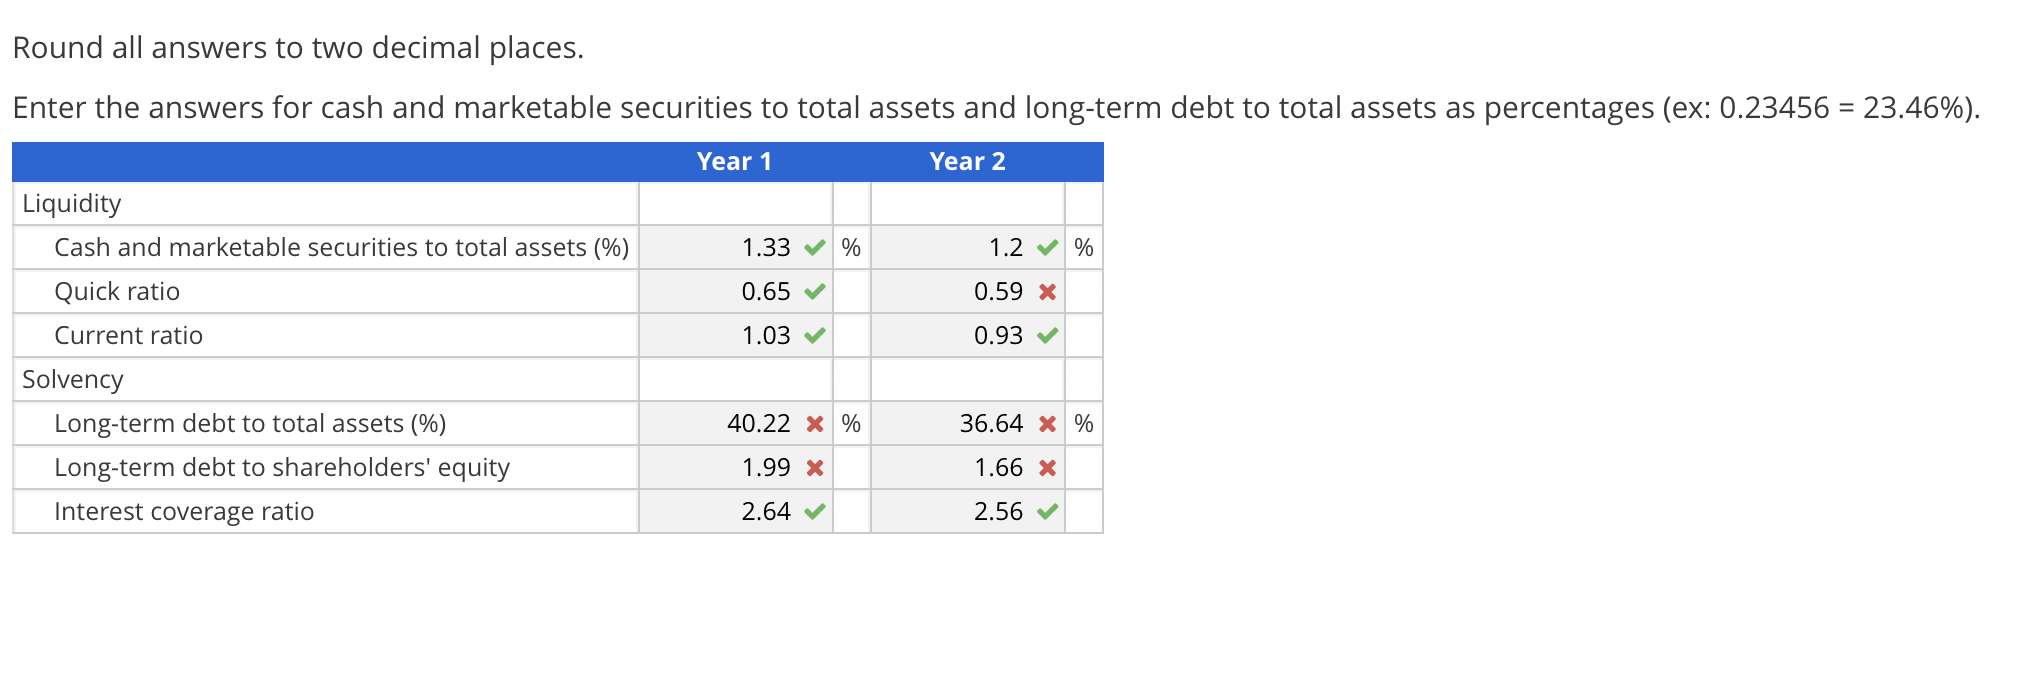
Analyzing Financial Risk Presented below are summary financial data from the Coca-Cola Enterprises, Inc., annual report. Using the ratio definitions from Exhibit 4.6, calculate the following liquidity and solvency ratios for Year 1 and Year 2. Year 1 Year 2 (amounts in millions) Balance sheet Cash and cash equivalents $355 $307 Marketable securities 0 0 Accounts receivable (net) Total current assets 1,884 1,802 3,571 3,595 26,661 25,557 3,451 3,846 Total assets Current liabilities 607 944 Current portion of long-term debt Long-term debt Shareholders' equity Income statement 10,723 9,365 5,378 5,643 Interest expense $619 $633 Net income before taxes 1,018 990 Round all answers to two decimal places. Enter the answers for cash and marketable securities to total assets and long-term debt to total assets as percentages (ex: 0.23456 = 23.46%). Year 1 Year 2 Liquidity Cash and marketable securities to total assets (%) Quick ratio 1.33 % 1.2 % 0.65 0.59 X Current ratio 1.03 0.93 40.22 X % 36.64 x % Solvency Long-term debt to total assets (%) Long-term debt to shareholders' equity Interest coverage ratio 1.99 x 1.66 x 2.64 2.56
Step by Step Solution
There are 3 Steps involved in it

Get step-by-step solutions from verified subject matter experts