

Question: Analyzing Financial Risk Presented below are summary financial data from the General Electric Company annual report. Using the ratio definitions from Exhibit 4.6, calculate the
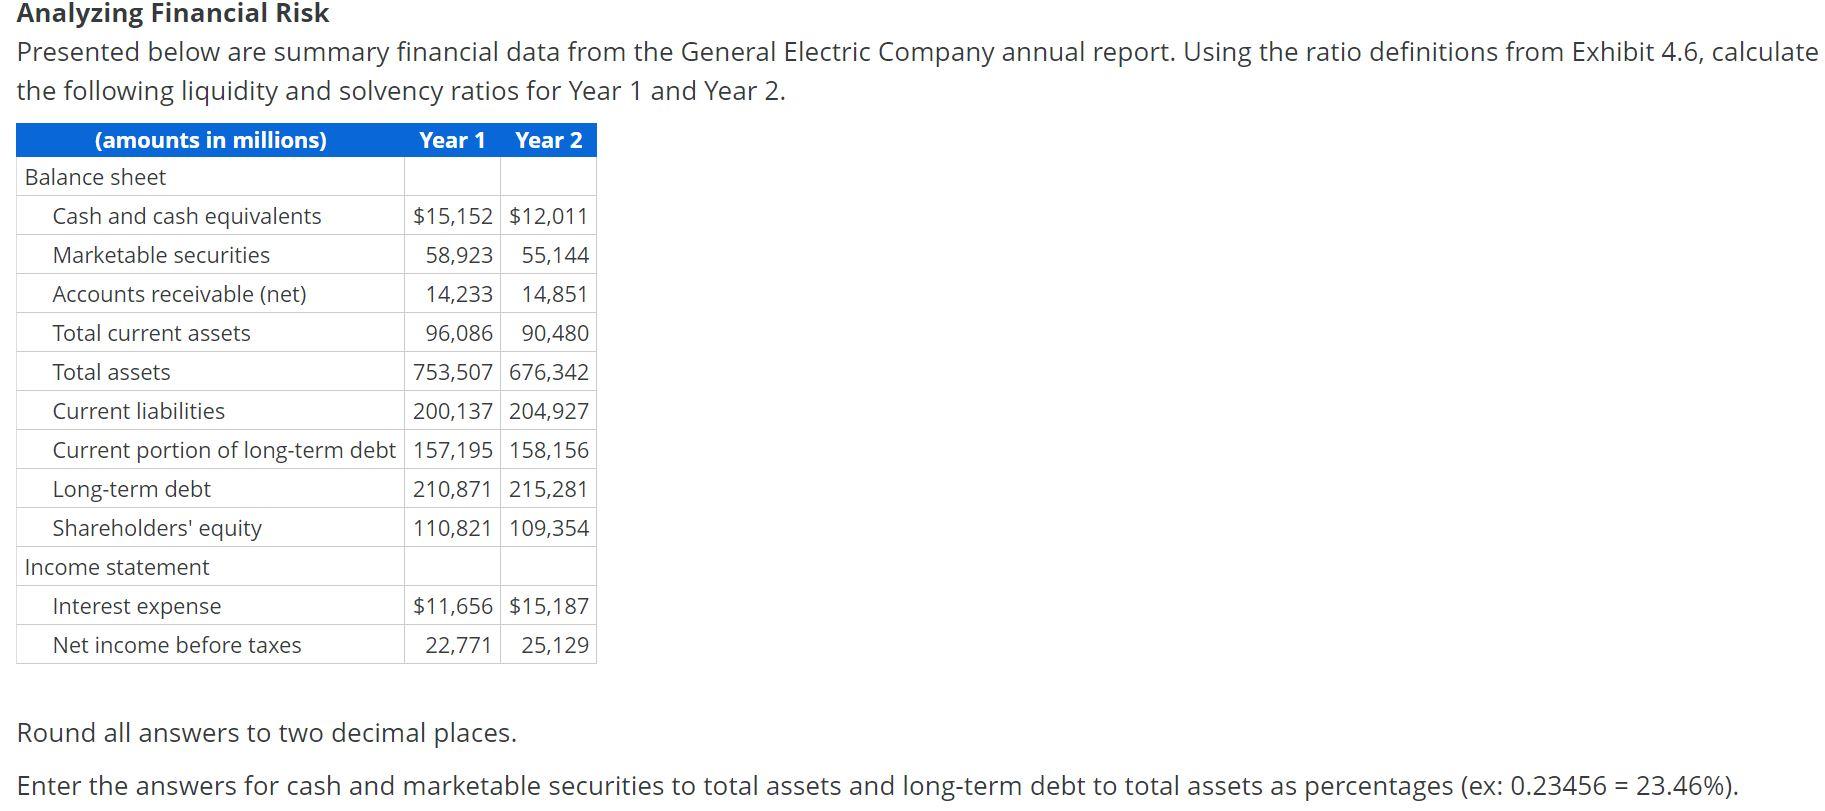
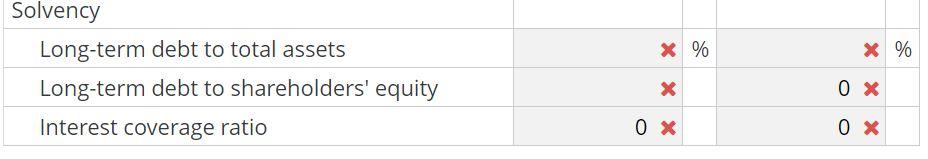
Analyzing Financial Risk Presented below are summary financial data from the General Electric Company annual report. Using the ratio definitions from Exhibit 4.6, calculate the following liquidity and solvency ratios for Year 1 and Year 2. (amounts in millions) Year 1 Year 2 Balance sheet Cash and cash equivalents $15,152 $12,011 Marketable securities 58,923 55,144 Accounts receivable (net) 14,233 14,851 Total current assets 96,086 90,480 Total assets 753,507 676,342 Current liabilities 200,137 204,927 Current portion of long-term debt 157,195 158,156 Long-term debt 210,871 215,281 Shareholders' equity 110,821 109,354 Income statement Interest expense Net income before taxes $11,656 $15,187 22,771 25,129 Round all answers to two decimal places. Enter the answers for cash and marketable securities to total assets and long-term debt to total assets as percentages (ex: 0.23456 = 23.46%). x % X % Solvency Long-term debt to total assets Long-term debt to shareholders' equity Interest coverage ratio x x OX OX OX
Step by Step Solution
There are 3 Steps involved in it

Get step-by-step solutions from verified subject matter experts