Question: Analyzing, Forecasting, and Interpreting Both Income Statement and Balance Sheet Following are the income statements and balance sheets of Best Buy Co., Inc. Income Statement,
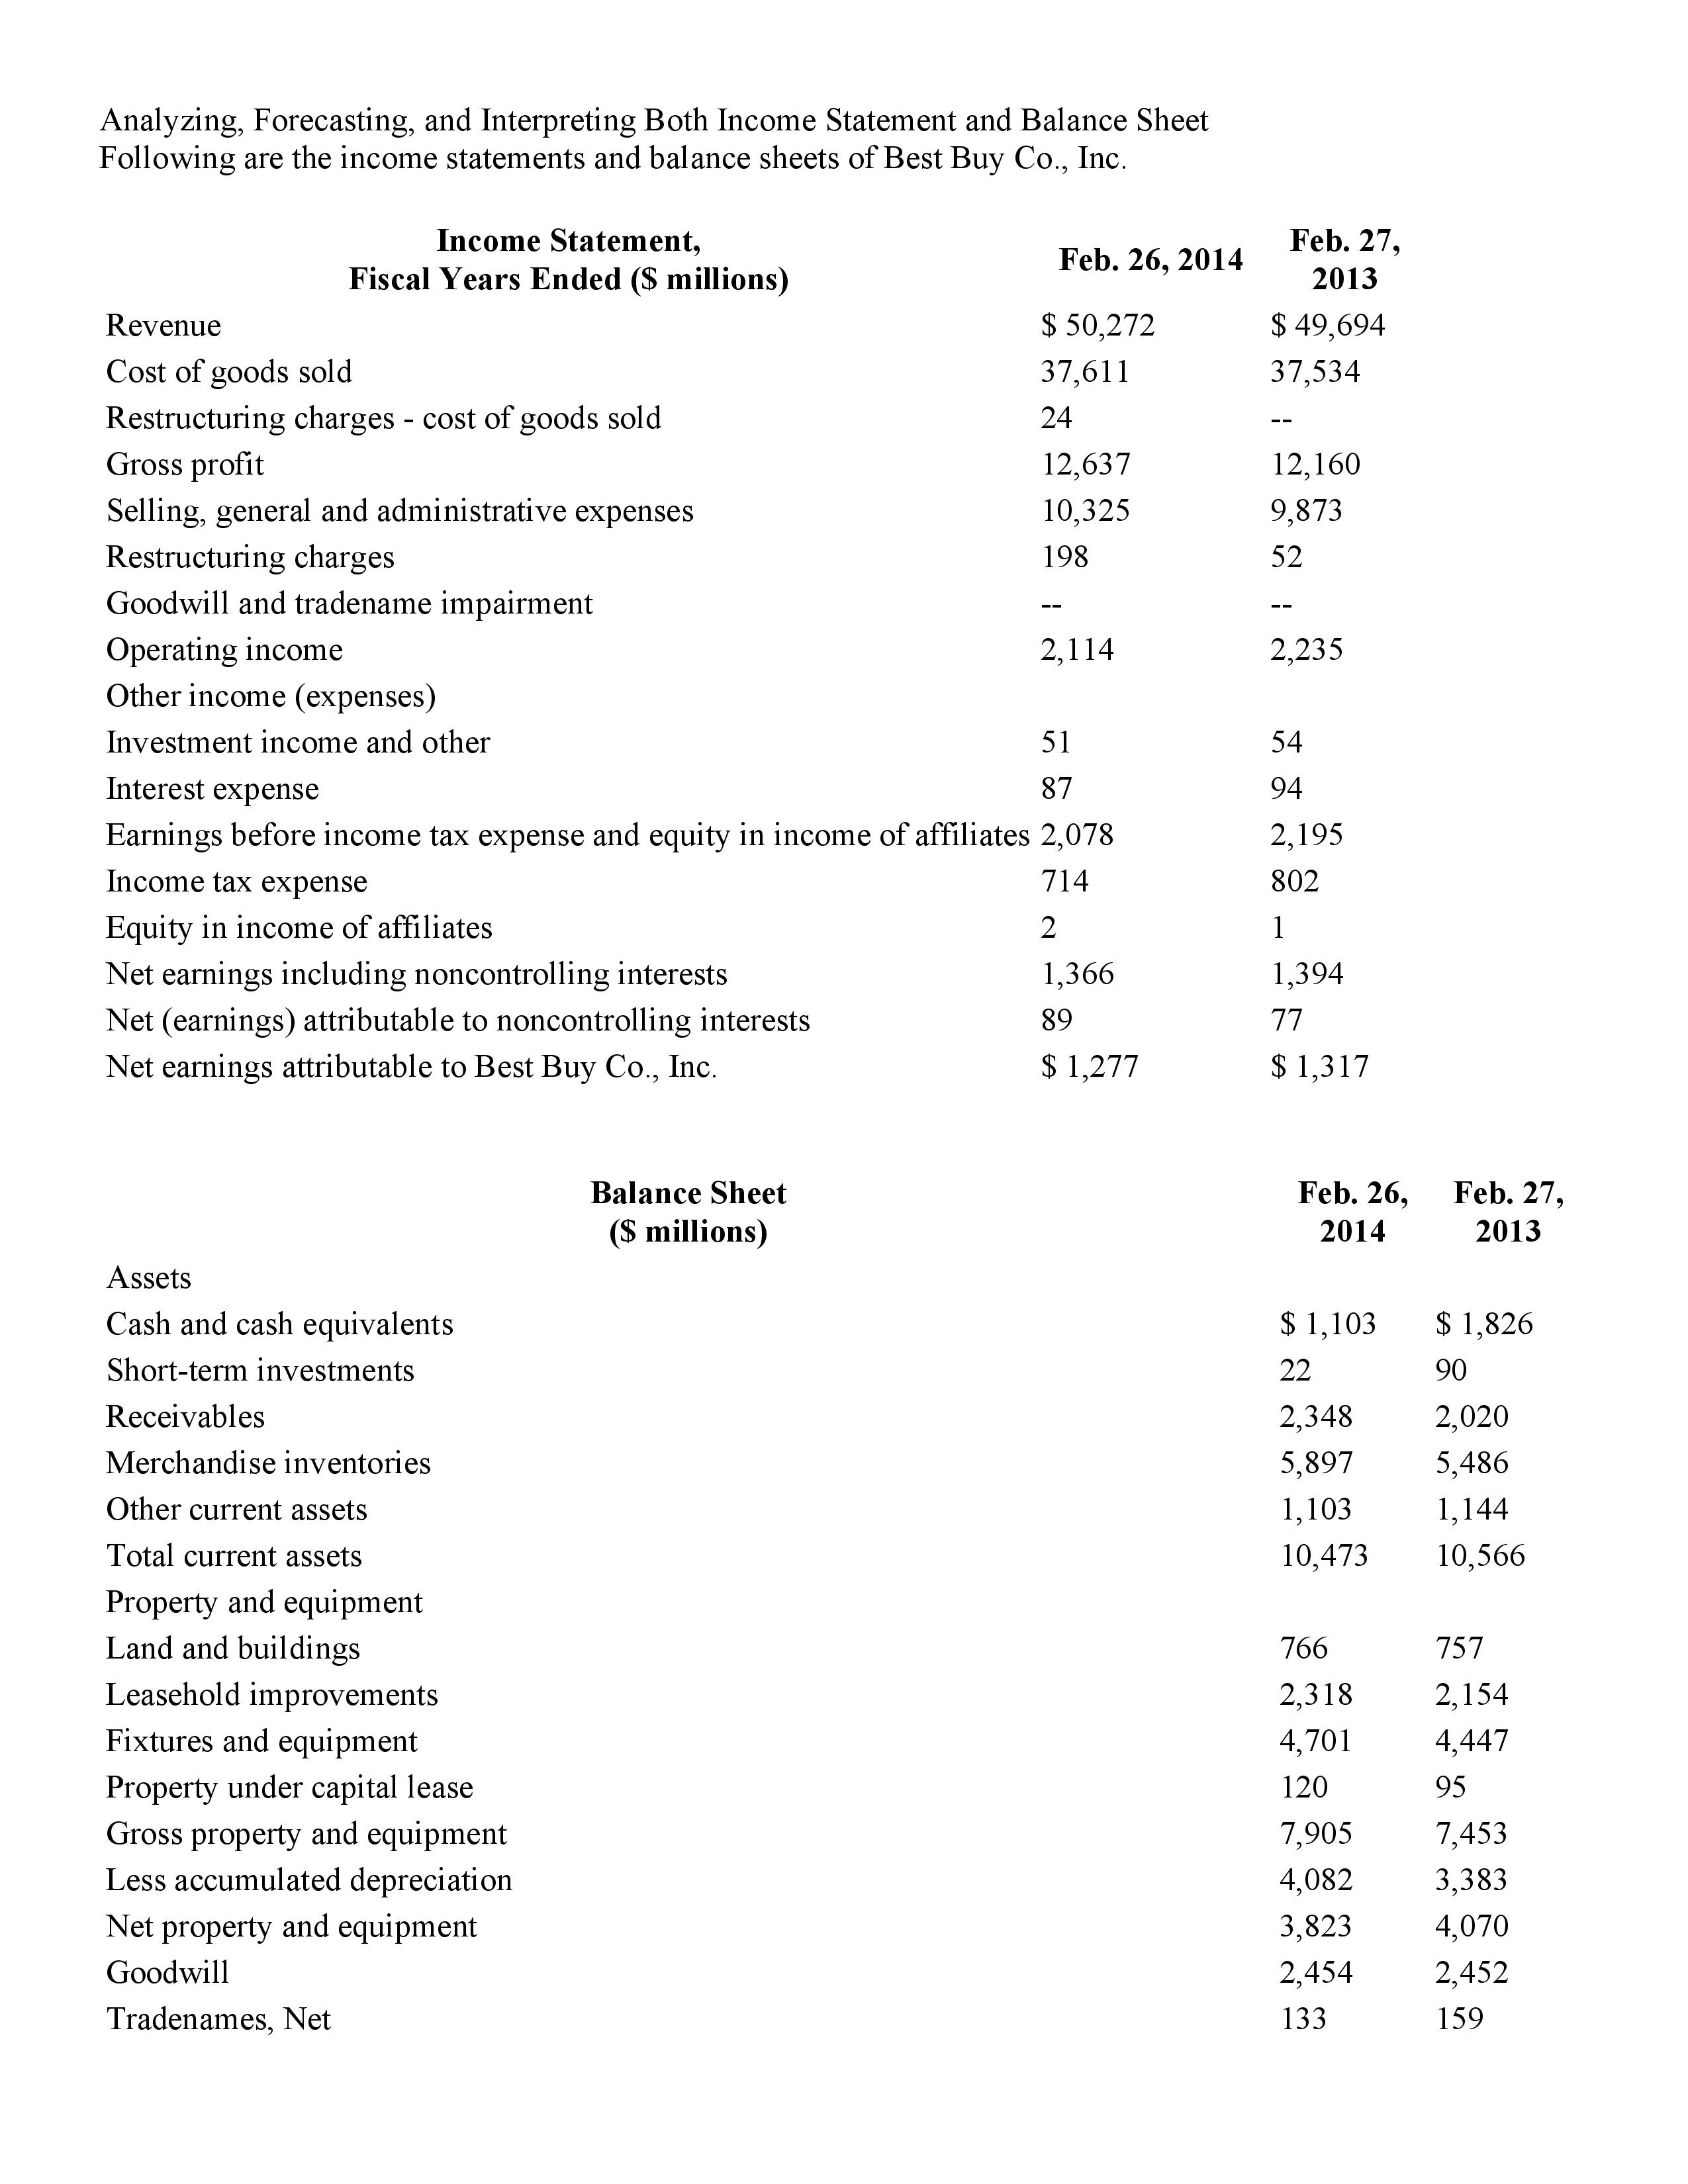
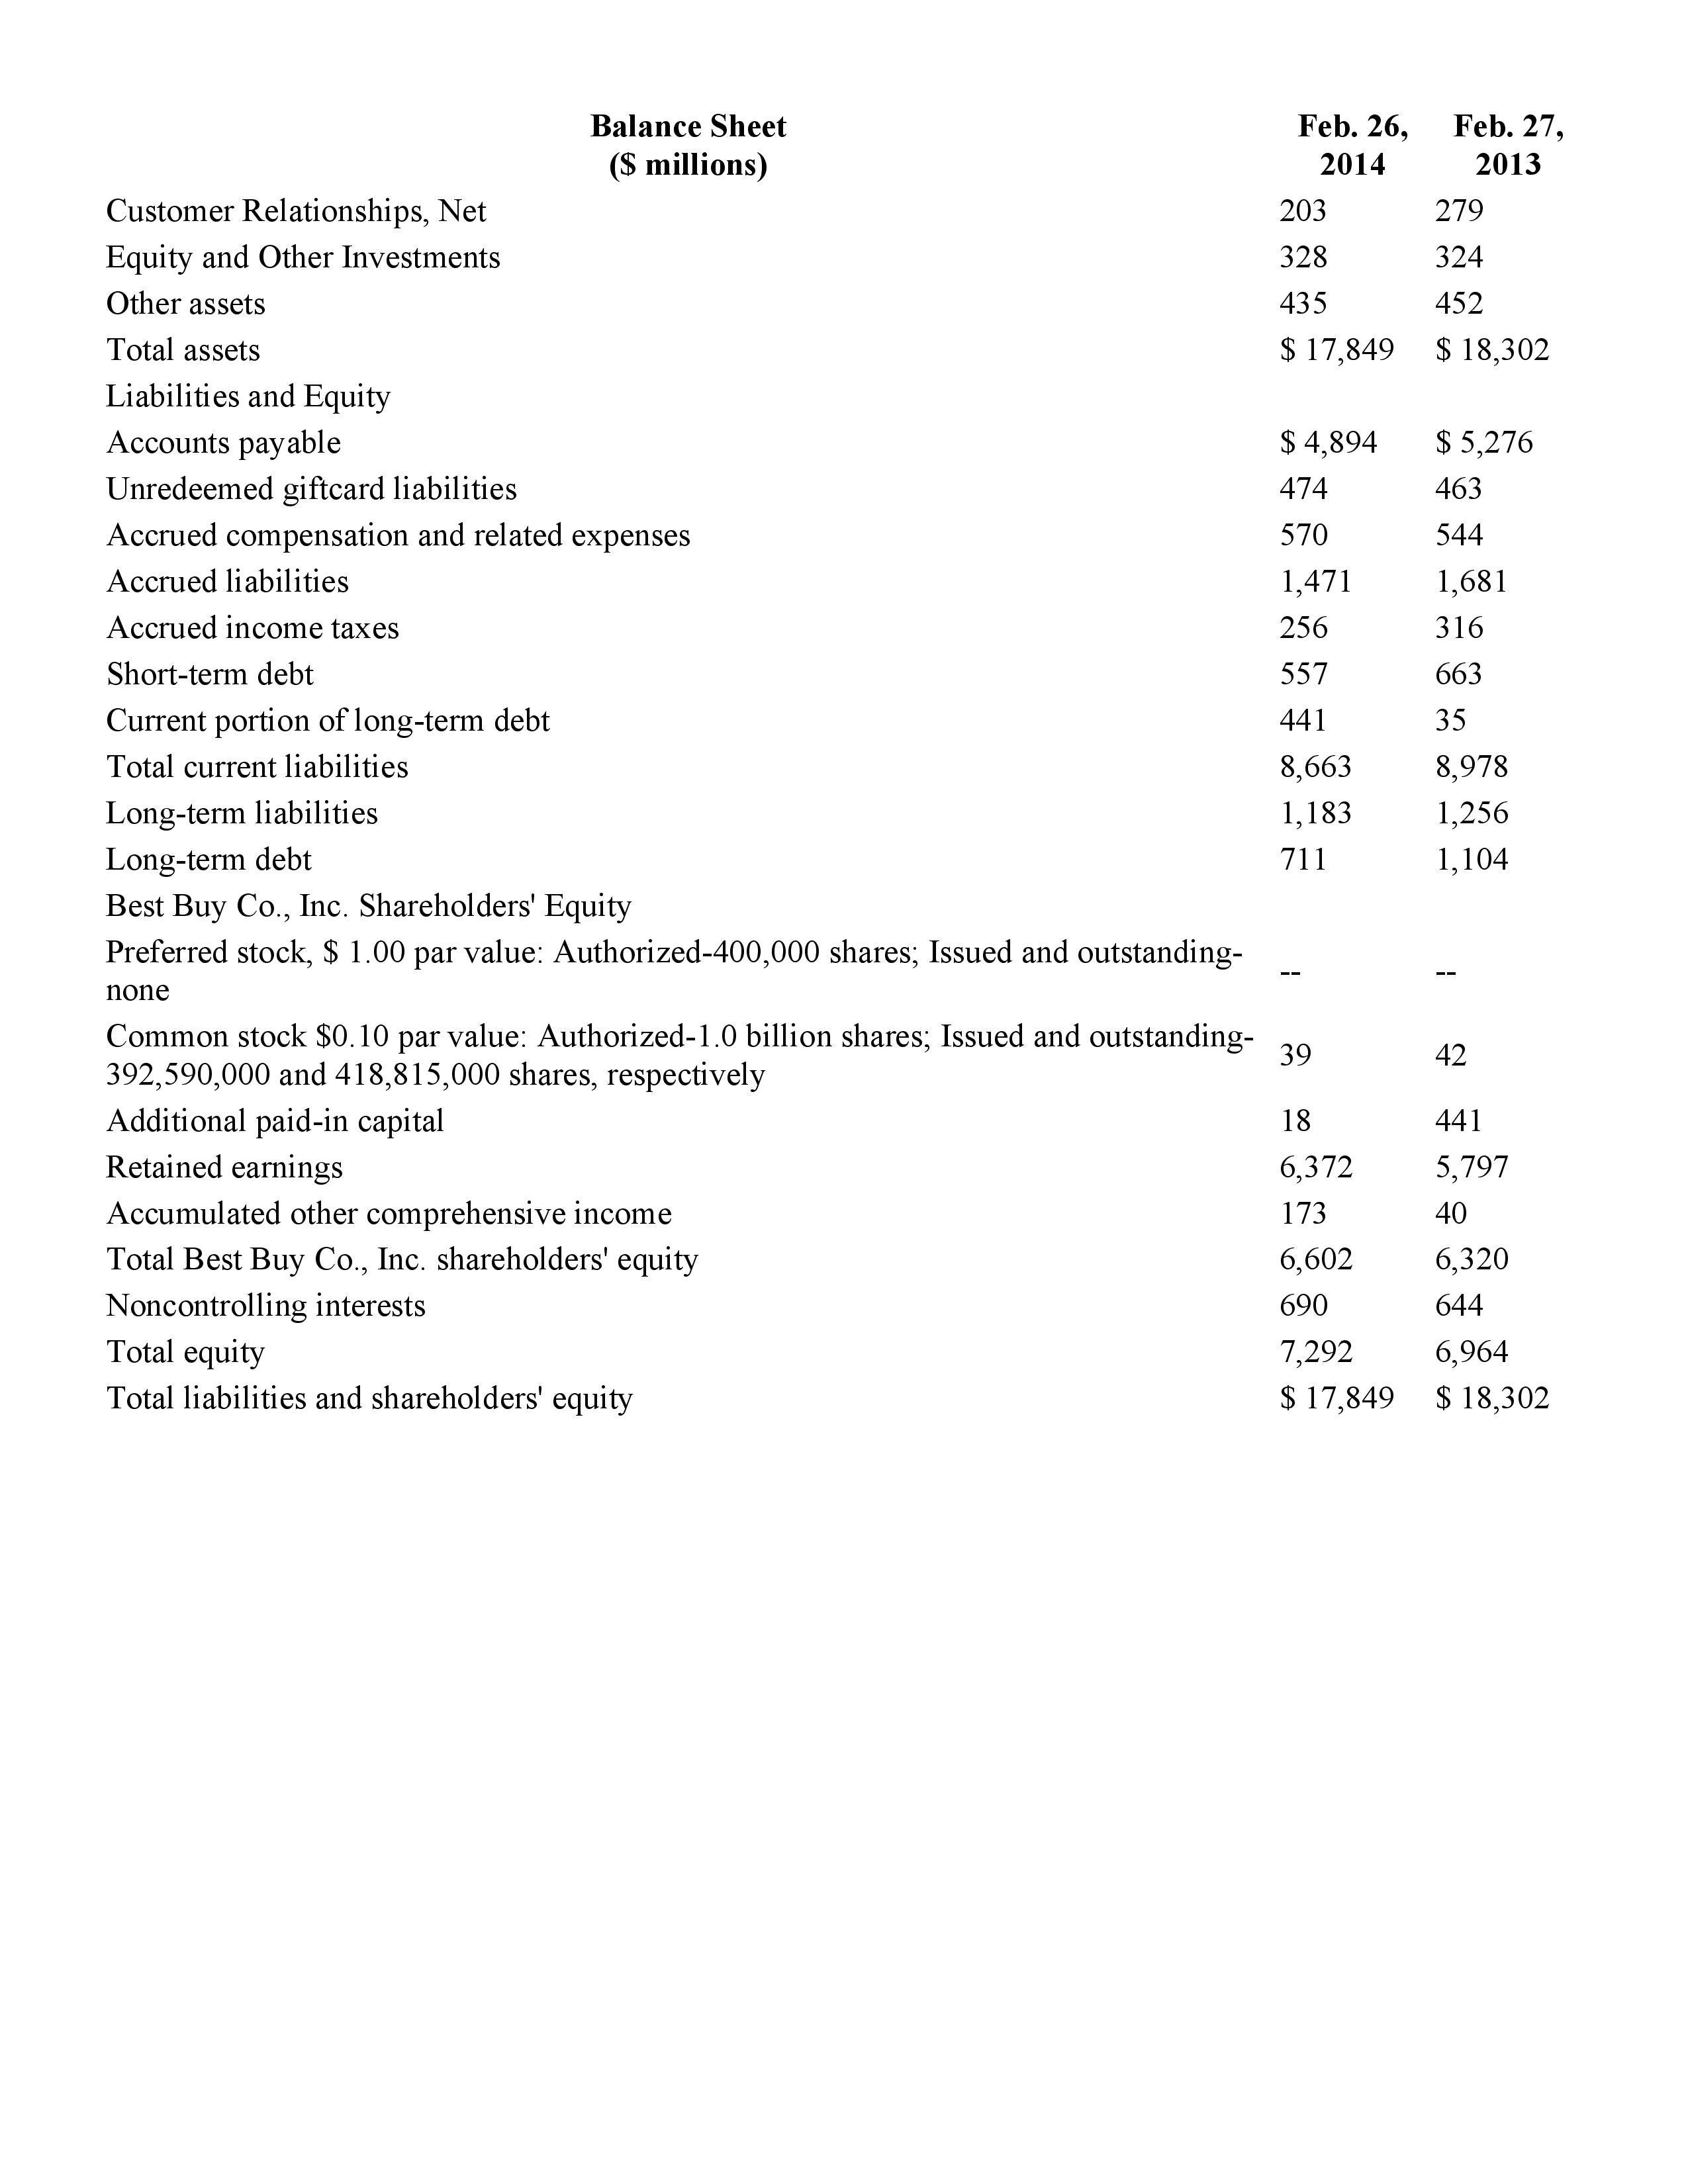
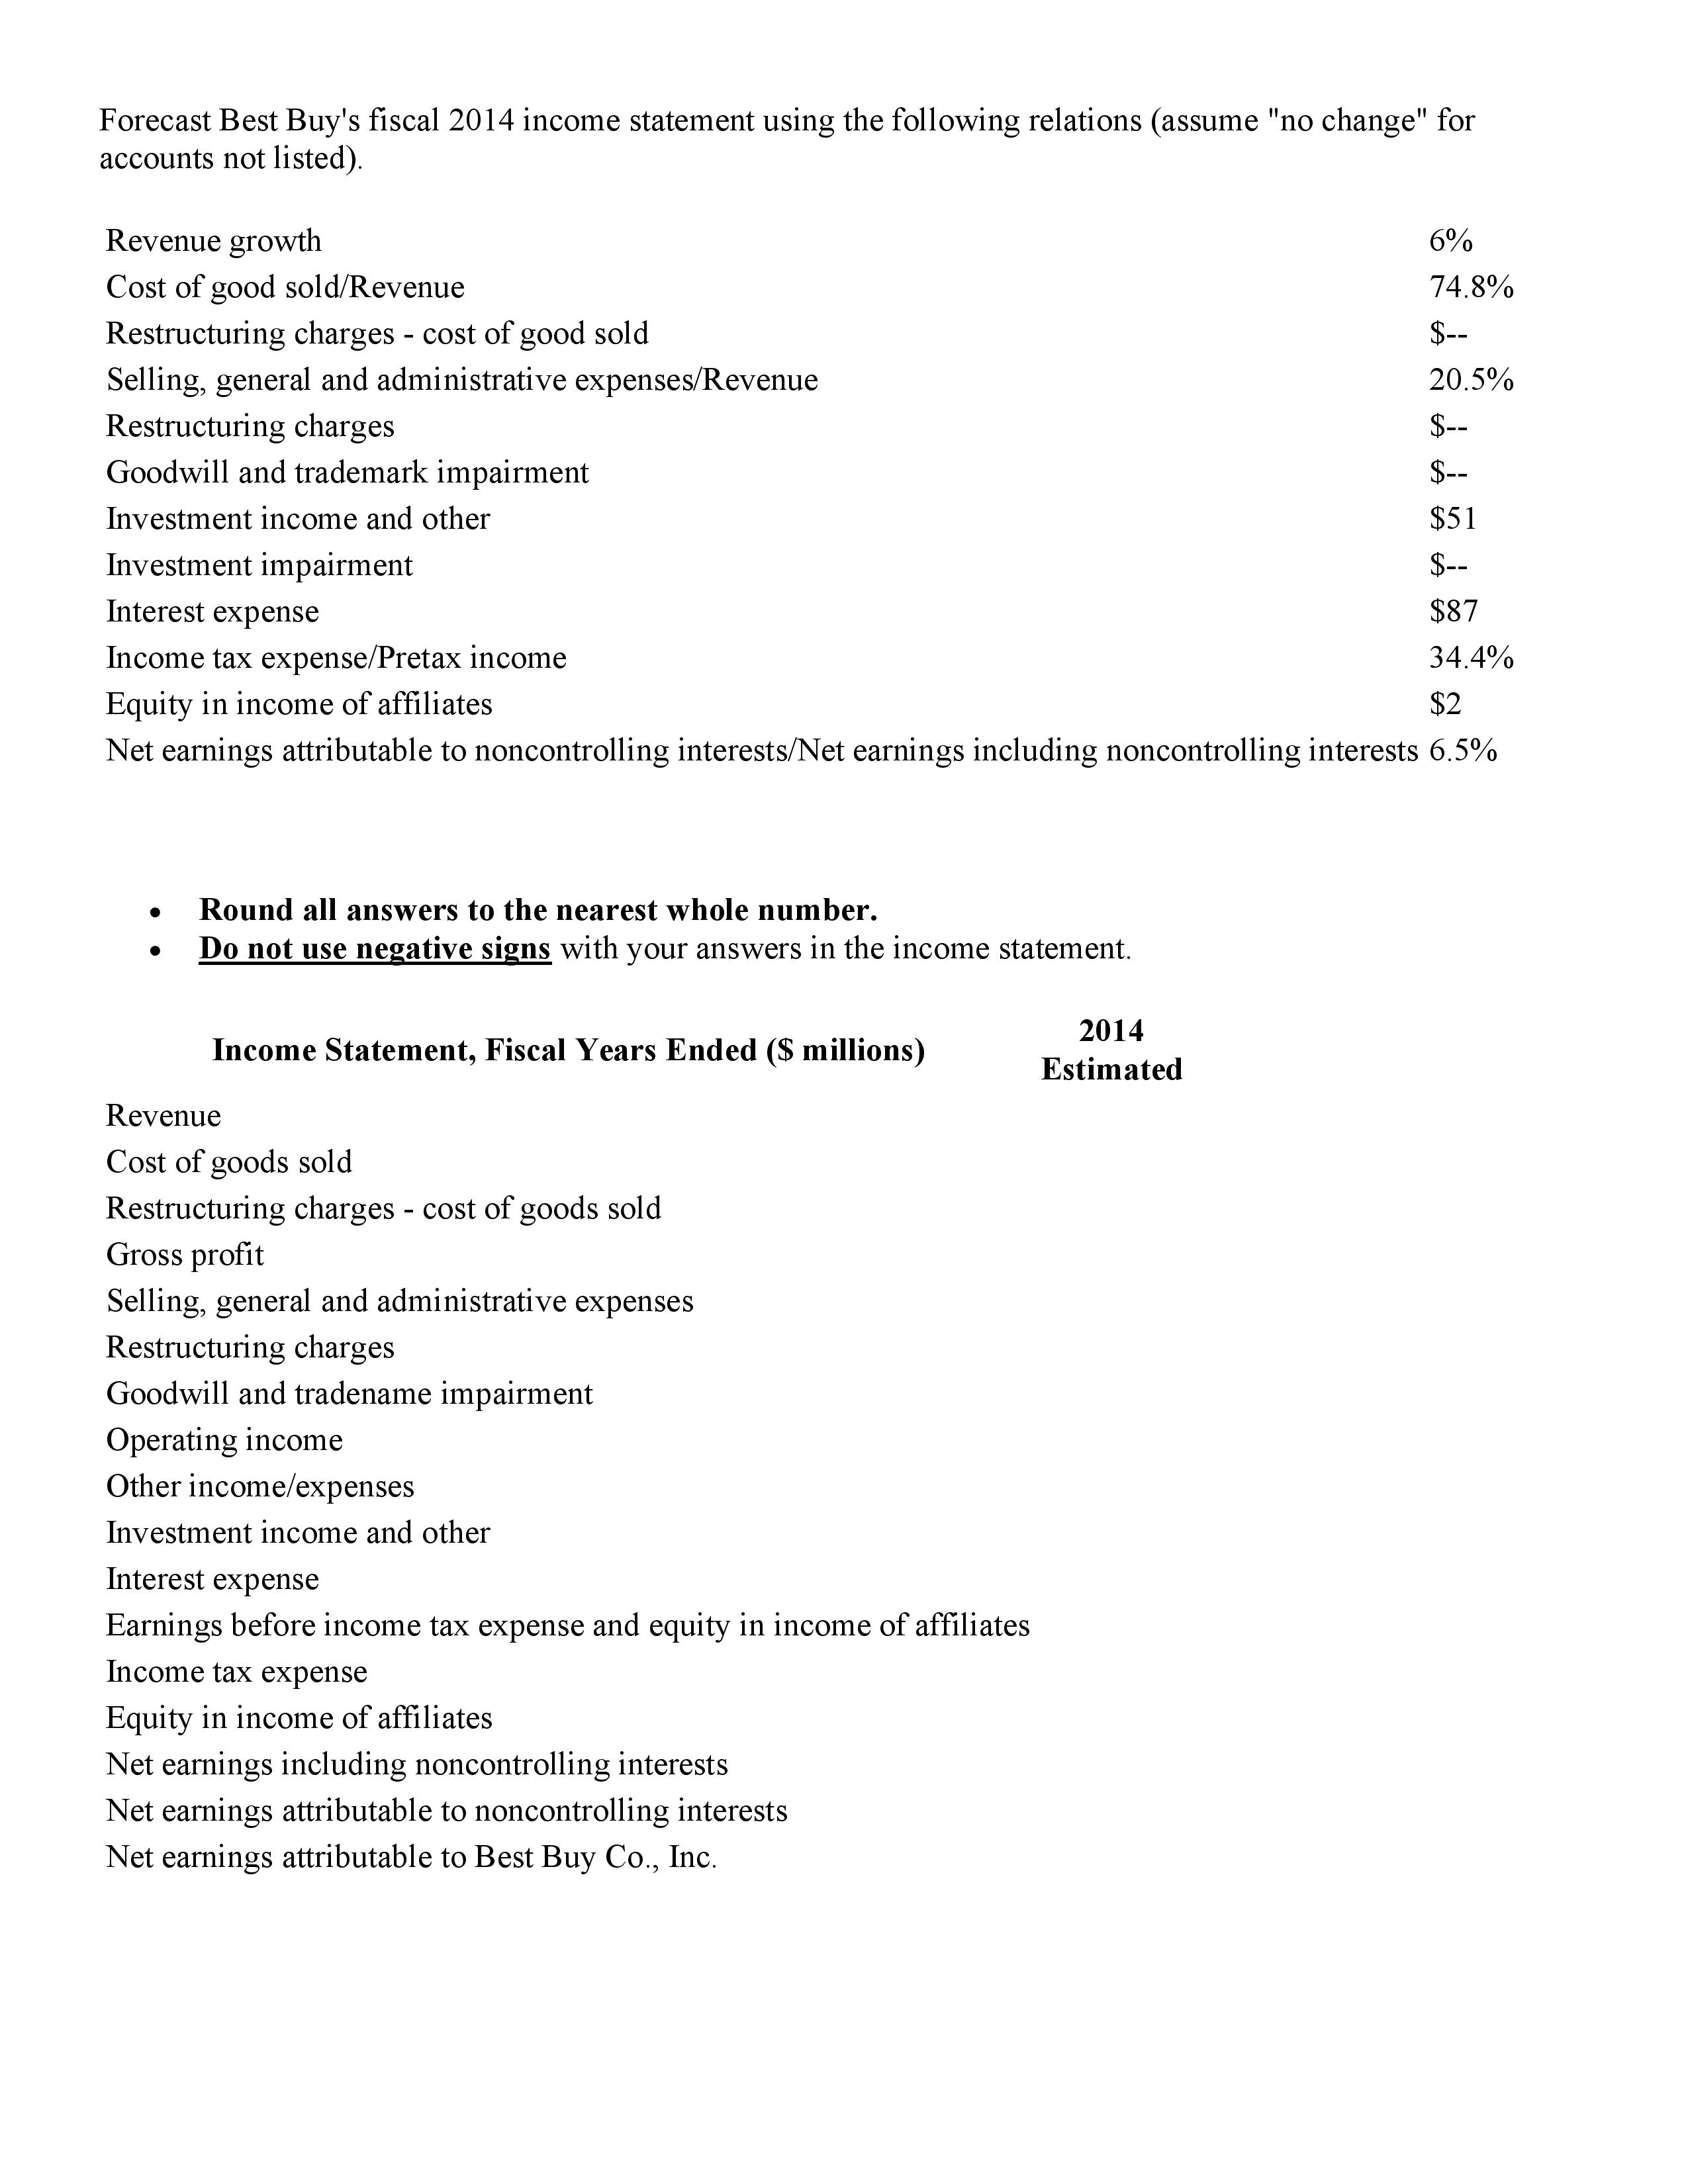
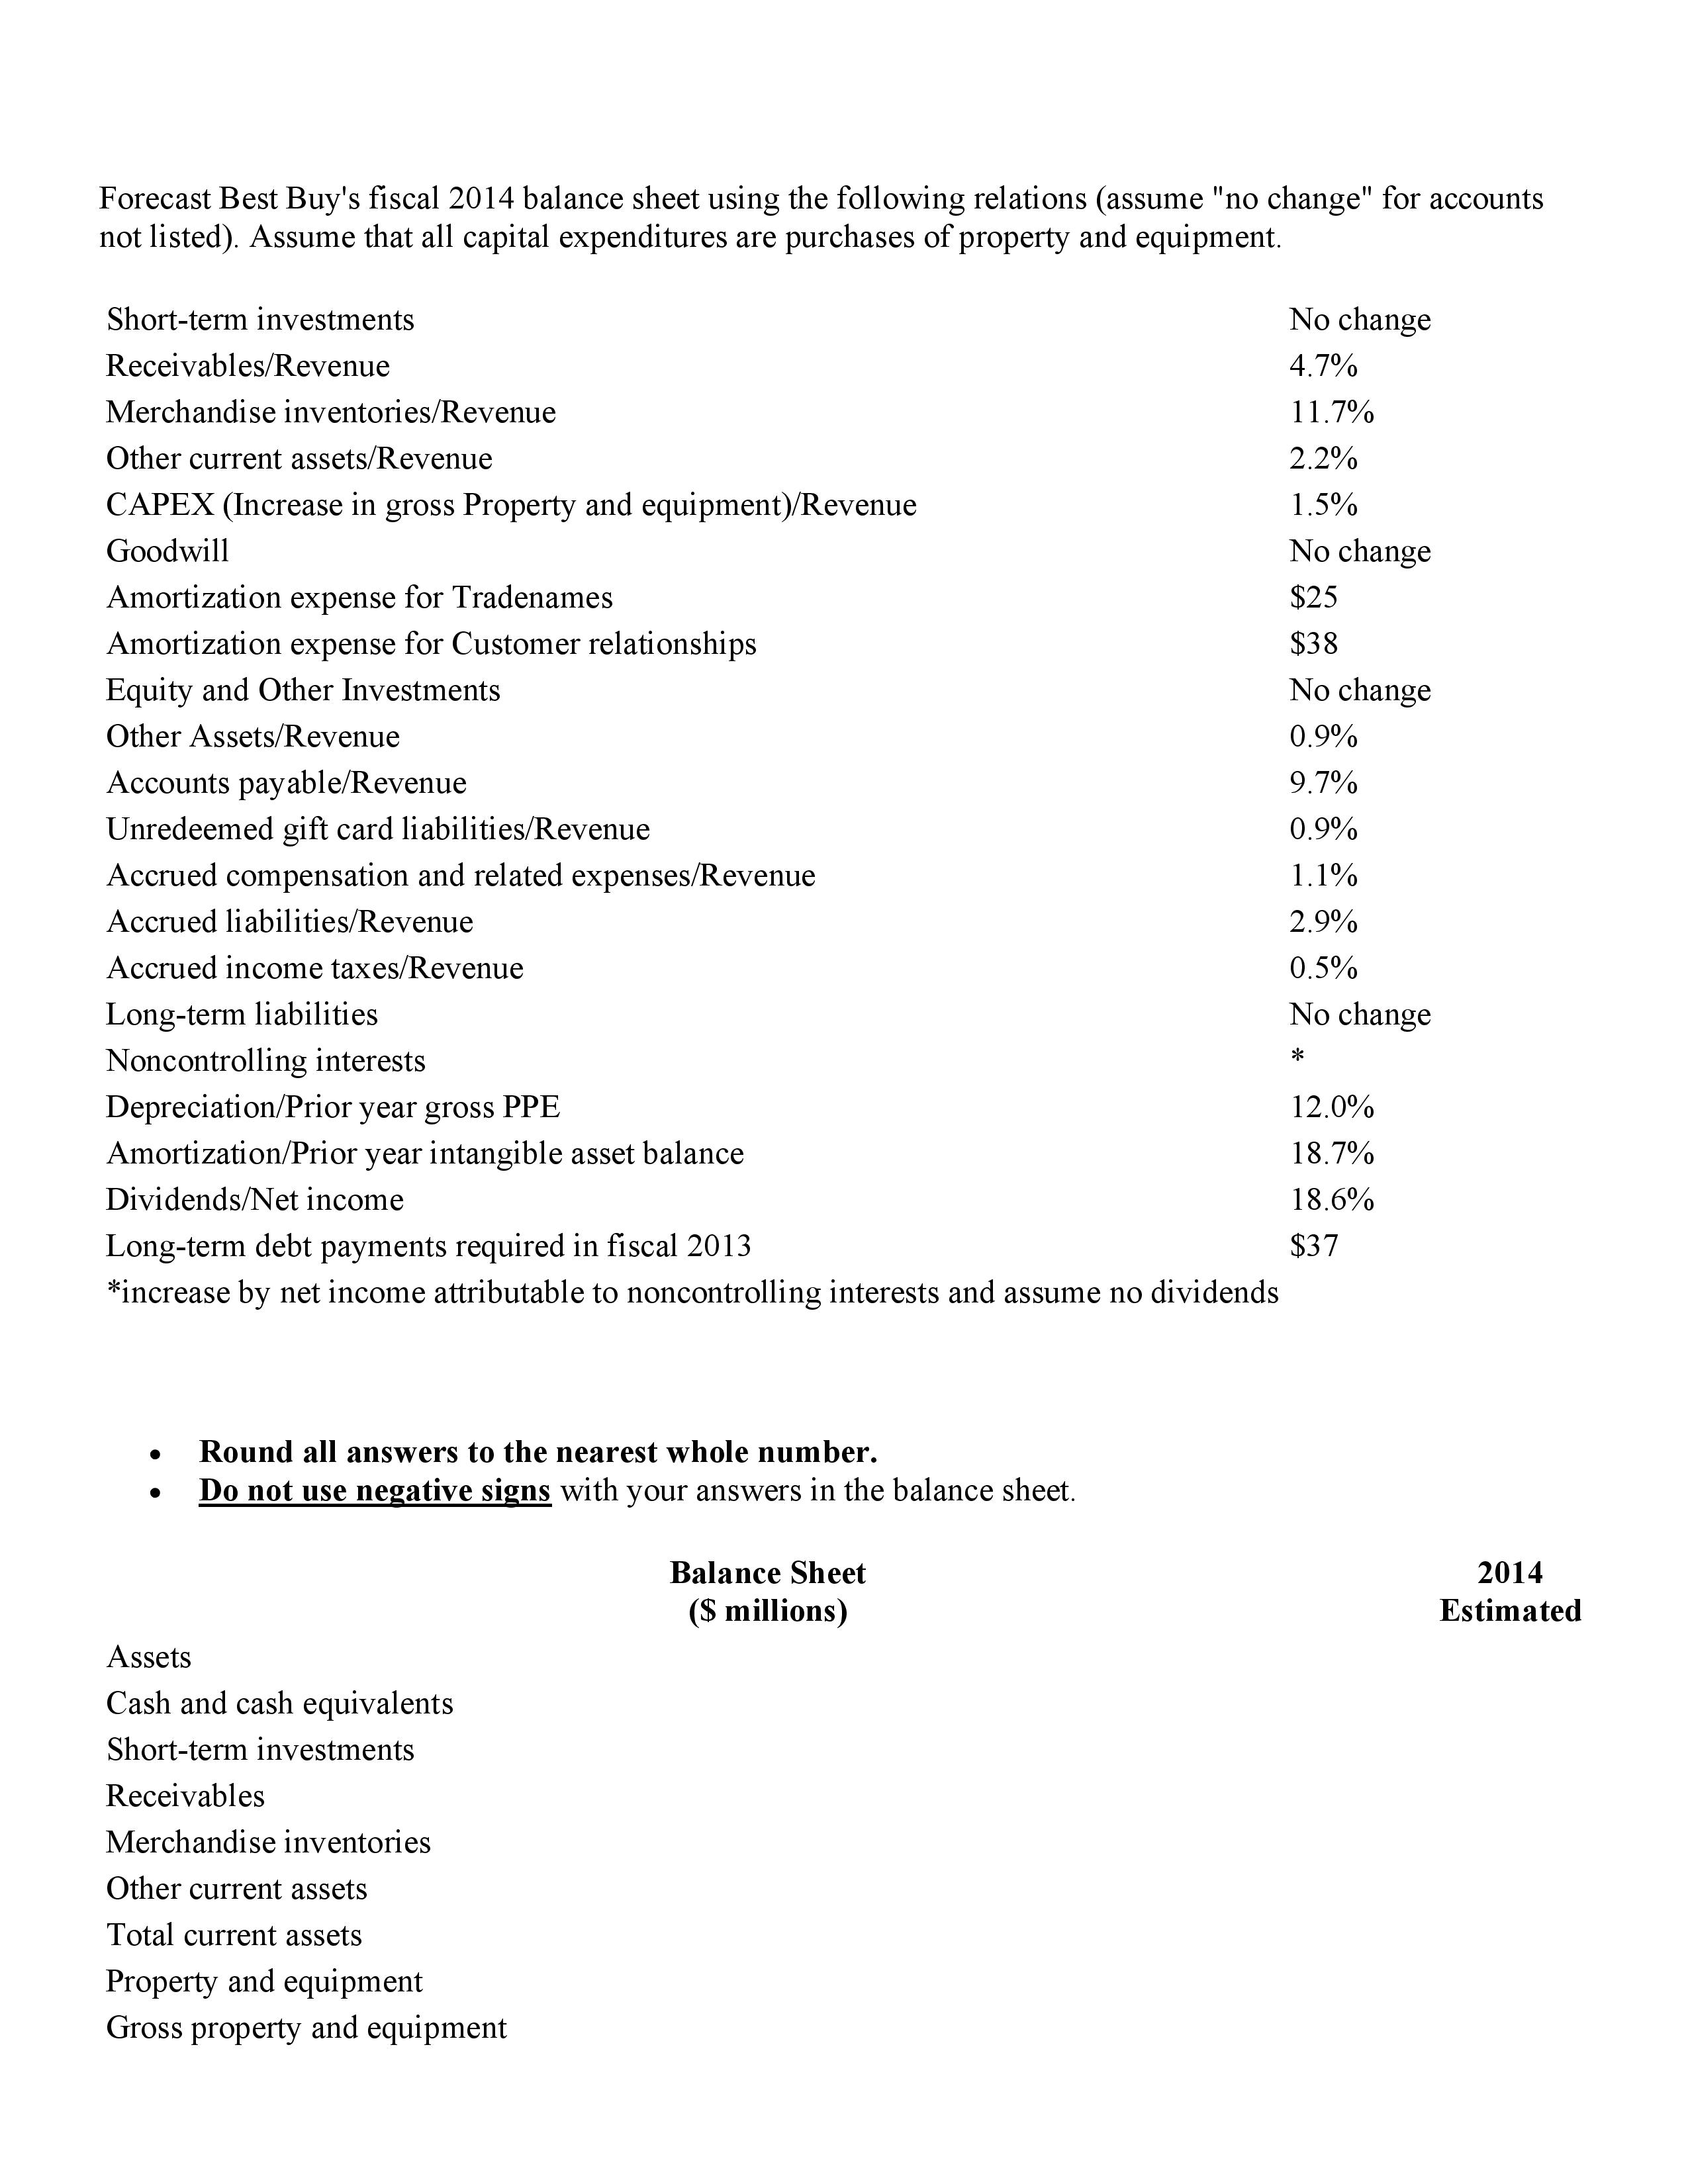
Analyzing, Forecasting, and Interpreting Both Income Statement and Balance Sheet Following are the income statements and balance sheets of Best Buy Co., Inc. Income Statement, Fiscal Years Ended (S millions) Revenue Cost of goods sold Restructuring charges - cost of goods sold Gross profit Selling, general and administrative expenses Restructuring charges Goodwill and tradename impairment Operating income Other income (expenses) Investment income and other Interest expense Earnings before income tax expense and equity in income of affiliates 2,078 714 Income tax expense Equity in income of afliates Net earnings including noncontrolling interests Net (earnings) attributable to noncontrolling interests Net earnings attributable to Best Buy Co., Inc. Assets Cash and cash equivalents Shortterm investments Receivables Merchandise inventories Other current assets Total current assets Property and equipment Land and buildings Leasehold improvements Fixtures and equipment Property under capital lease Gross property and equipment Less accumulated depreciation Net property and equipment Goodwill Tradenames, Net Balance Sheet ($ millions) Feb. 26, 2014 $ 50,272 37,611 12,637 10,325 198 2,114 1,366 $ 1,277 Feb. 27, 2013 $ 49,694 37,534 12,160 9,873 52 2,235 54 94 2,195 802 1 1,394 77 $ 1,317 Feb. 26, 2014 $ 1,103 22 2,348 5,897 1,103 10,473 766 2,318 4,701 120 7,905 4,082 3,823 2,454 133 Feb. 27, 2013 $ 1,826 90 2,020 5,486 1,144 10,566 757 2,154 4,447 95 7,453 3,383 4,070 2,452 159 Balance Sheet Feb. 26, Feb. 27, ($ millions) 2014 2013 Customer Relationships, Net 203 279 Equity and Other Investments 328 324 Other assets 435 452 Total assets $ 17,849 $ 18,302 Liabilities and Equity Accounts payable $ 4,894 $ 5,276 Unredeemed giftcard liabilities 474 463 Accrued compensation and related expenses 570 544 Accrued liabilities 1,471 1,681 Accrued income taxes 256 316 Short-term debt 557 663 Current portion of longterm debt 441 35 Total current liabilities 8,663 8,978 Longterm liabilities 1,183 1,256 Long-term debt 71 1 1,104 Best Buy Co., Inc. Shareholders' Equity Preferred stock, $ 1.00 par value: Authorized-400,000 shares; Issued and outstanding- none Common stock $0.10 par value: Authorized1.0 billion shares; Issued and outstanding 392,590,000 and 418,815,000 shares, respectively 39 42 Additional paidin capital 18 441 Retained earnings 6,372 5,797 Accumulated other comprehensive income 173 40 Total Best Buy Co., Inc. Shareholders' equity 6,602 6,320 Noncontrolling interests 690 644 Total equity 7,292 6,964 Total liabilities and Shareholders' equity $ 17,849 $ 18,302 Forecast Best Buy's fiscal 2014 income statement using the following relations (assume "no change" for accounts not listed). Revenue growth 5% Cost of good sold/Revenue 74.8% Restructuring charges - cost of good sold $-- Selling, general and administrative expenses/Revenue 20.5% Restructuring charges $-- Goodwill and trademark impairment $-- Investment income and other $51 Investment impairment $-- Interest expense $87 Income tax expense/Pretax income 34.4% Equity in income of affiliates $2 Net earnings attributable to noncontrolling interests/Net earnings including noncontrolling interests 6.5% Round all answers to the nearest whole number. Do not use negative signs with your answers in the income statement. 2014 Income Statement, Fiscal Years Ended ($ millions) Estimated Revenue Cost of goods sold Restructuring charges - cost of goods sold Gross profit Selling, general and administrative expenses Restructuring charges Goodwill and tradename impairment Operating income Other income/expenses Investment income and other Interest expense Earnings before income tax expense and equity in income of affiliates Income tax expense Equity in income of affiliates Net earnings including noncontrolling interests Net earnings attributable to noncontrolling interests Net earnings attributable to Best Buy Co., Inc.Forecast Best Buy's scal 2014 balance sheet using the following relations (assume "no change" for accounts not listed). Assume that all capital expenditures are purchases of property and equipment. Short-term investments No change Receivables/Revenue 4.7% Merchandise inventories/Revenue 1 1.7% Other current assets/Revenue 2.2% CAPEX (Increase in gross Property and equipment)/Revenue 1.5% Goodwill No change Amortization expense for Tradenames $25 Amortization expense for Customer relationships $38 Equity and Other Investments No change Other Assets/Revenue 0.9% Accounts payable/Revenue 9.7% Unredeemed gift card liabilities/Revenue 0.9% Accrued compensation and related expenses/Revenue 1.1% Accrued li abilities/Revenue 2.9% Accrued income taxes/Revenue 0.5% Longterm liabilities No change Noncontrolling interests * Depreciation/Prior year gross PPE 12.0% Amortization/Prior year intangible asset balance 18.7% Dividends/Net income 18.6% Long-term debt payments required in scal 2013 $37 *increase by net income attributable to noncontrolling interests and assume no dividends . Round all answers to the nearest whole number. . Do not use negative signs with your answers in the balance sheet. Balance Sheet 2014 ($ millions) Estimated Assets Cash and cash equivalents Shortterm investments Receivables Merchandise inventories Other current assets Total current assets Property and equipment Gross property and equipment Balance Sheet 2014 ($ millions) Estimated Less accumulated depreciation Net property and equipment Goodwill Traden ames, Net Customer Relationships, Net Equity and Other Investments Other assets Total assets Liabilities and equity Accounts payable Unredeemed gift card liabilities Accrued compensation and related expenses Accrued liabilities Accrued income taxes Short-term debt Current portion of longterm debt Total current liabilities Long-term liabilities Long-term debt Best Buy Co., Inc. Shareholders' Equity Preferred stock, $1.00 par value: Authorized - 400,000 shares; Issued and outstanding - none Common stock, $0.10 par value: Authorized - 1.0 billion shares; Issued and outstanding - 392,590,000 and 418,815,000 shares, respectively Additional paidin capital Retained earnings Accumulated other comprehensive income Total Best Buy Co., Inc. Shareholders' equity N oncontrolling interests Total equity Total liabilities and Equity