

Question: Analyzing, Forecasting, and Interpreting Both Income Statement and Balance Sheet Following are the income statements and balance sheets of Best Buy Co., Ind. Income Statement,
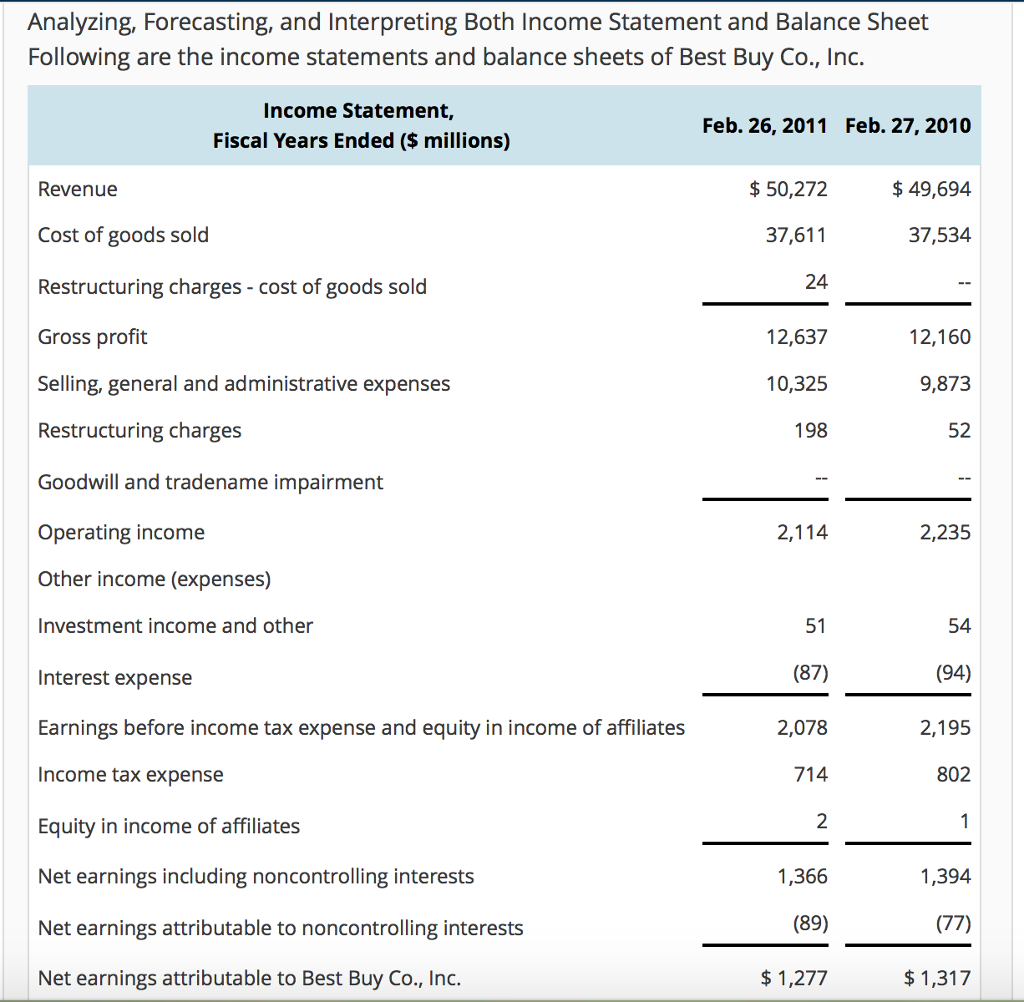
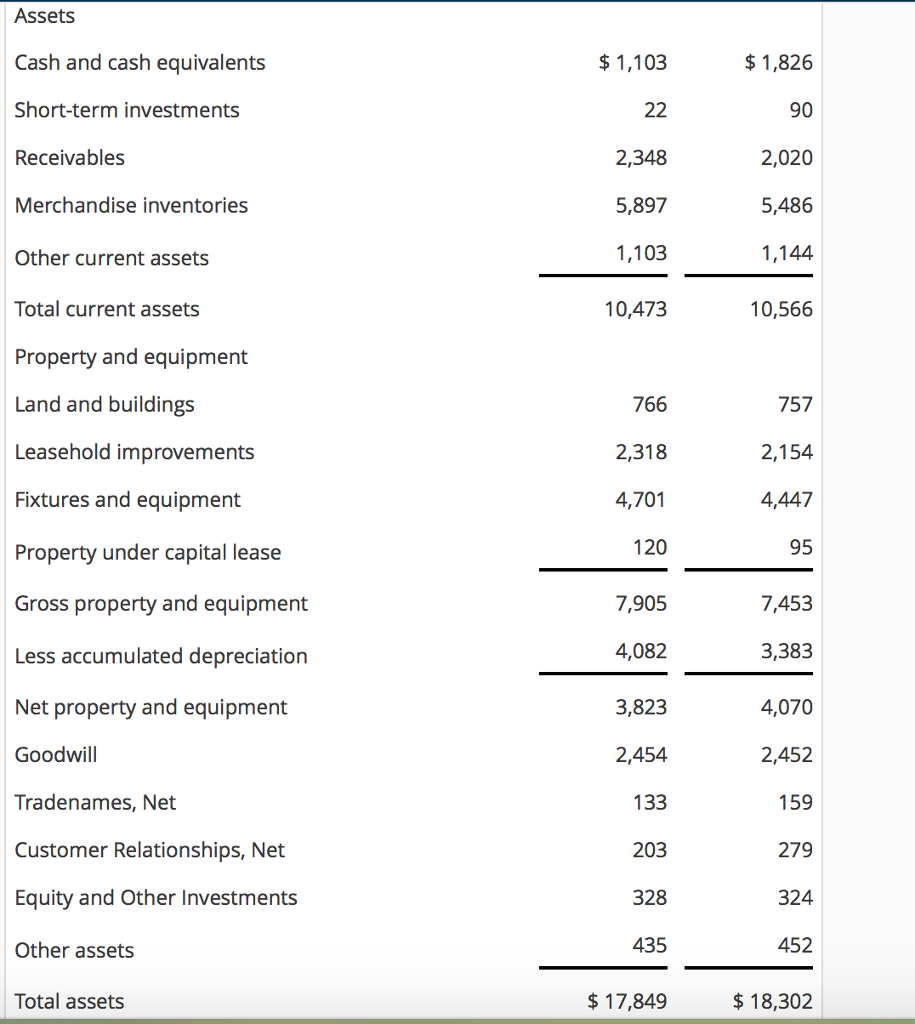
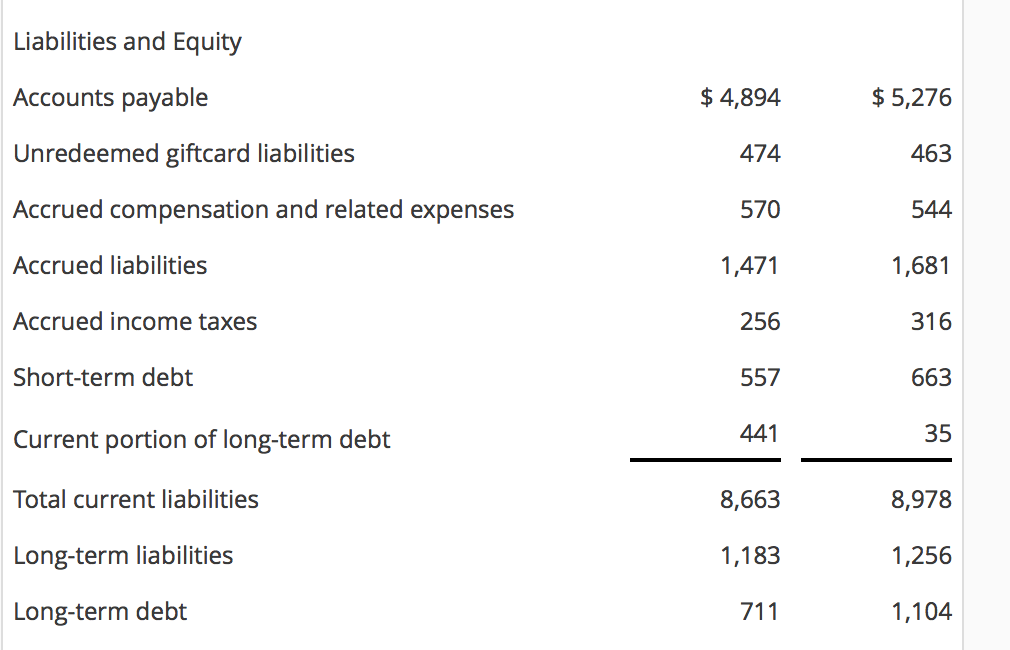
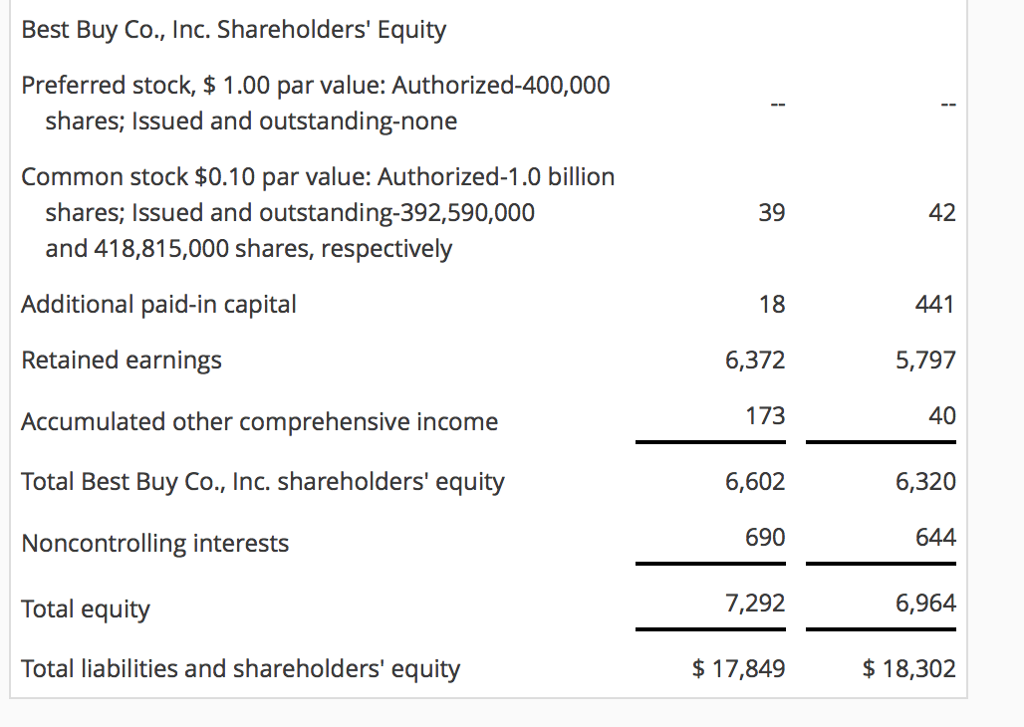
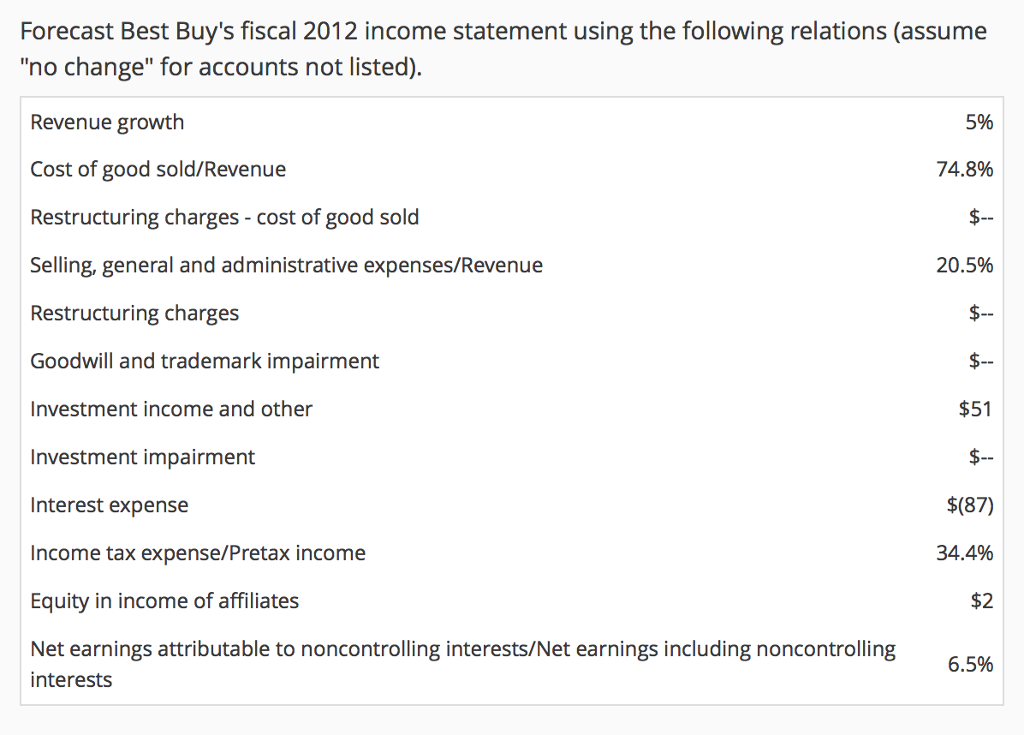
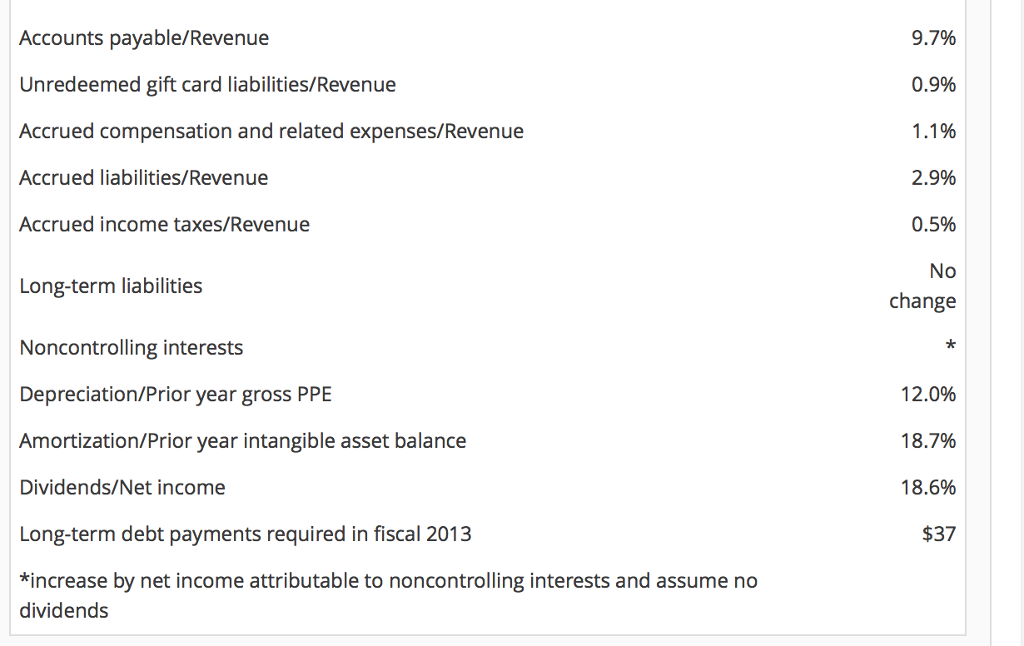
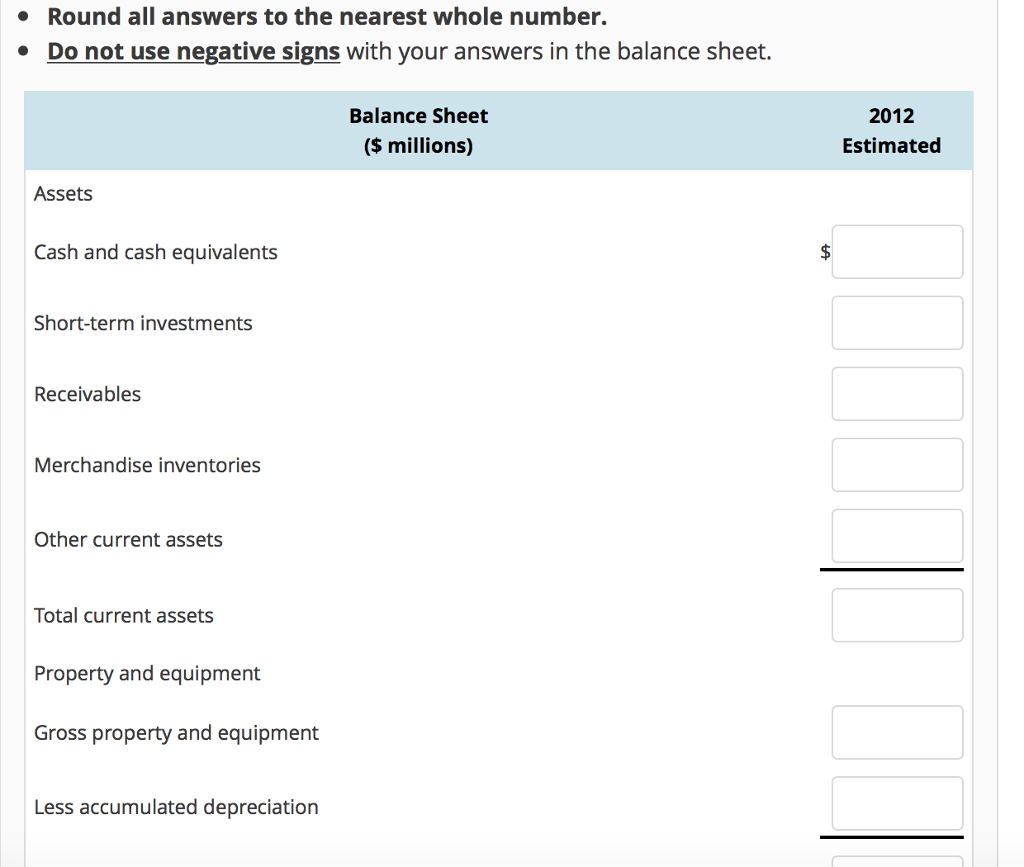
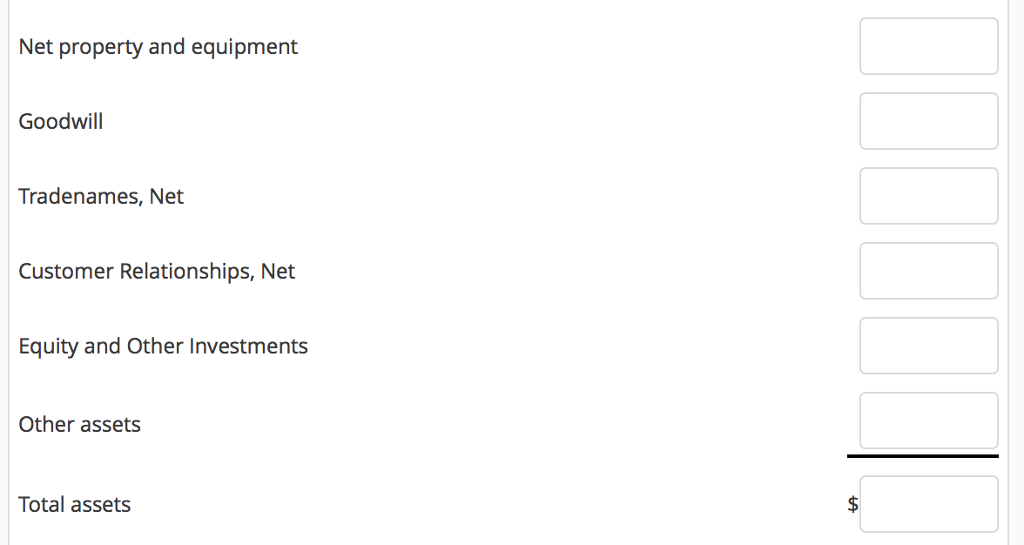
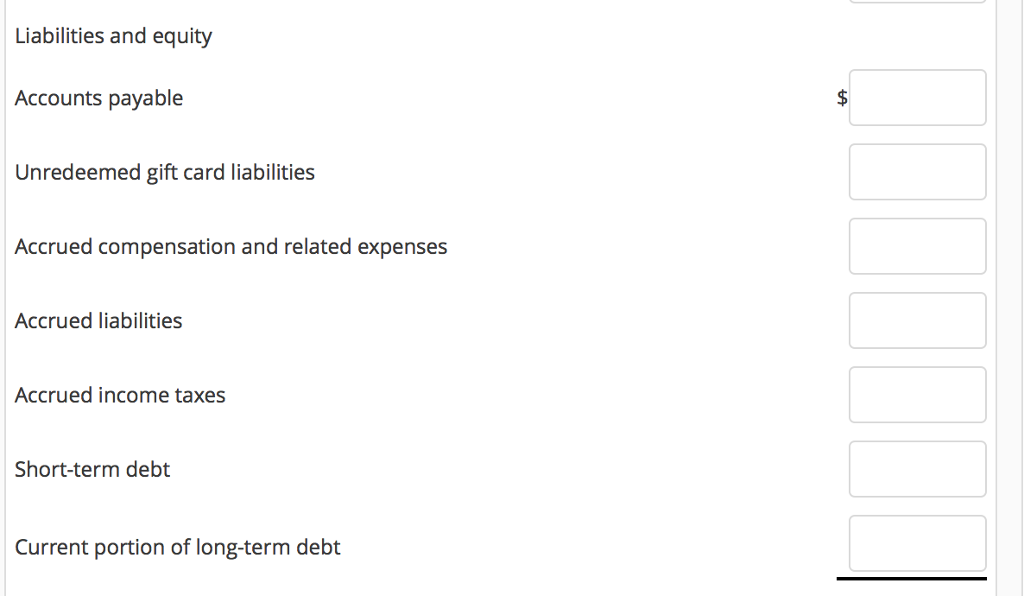
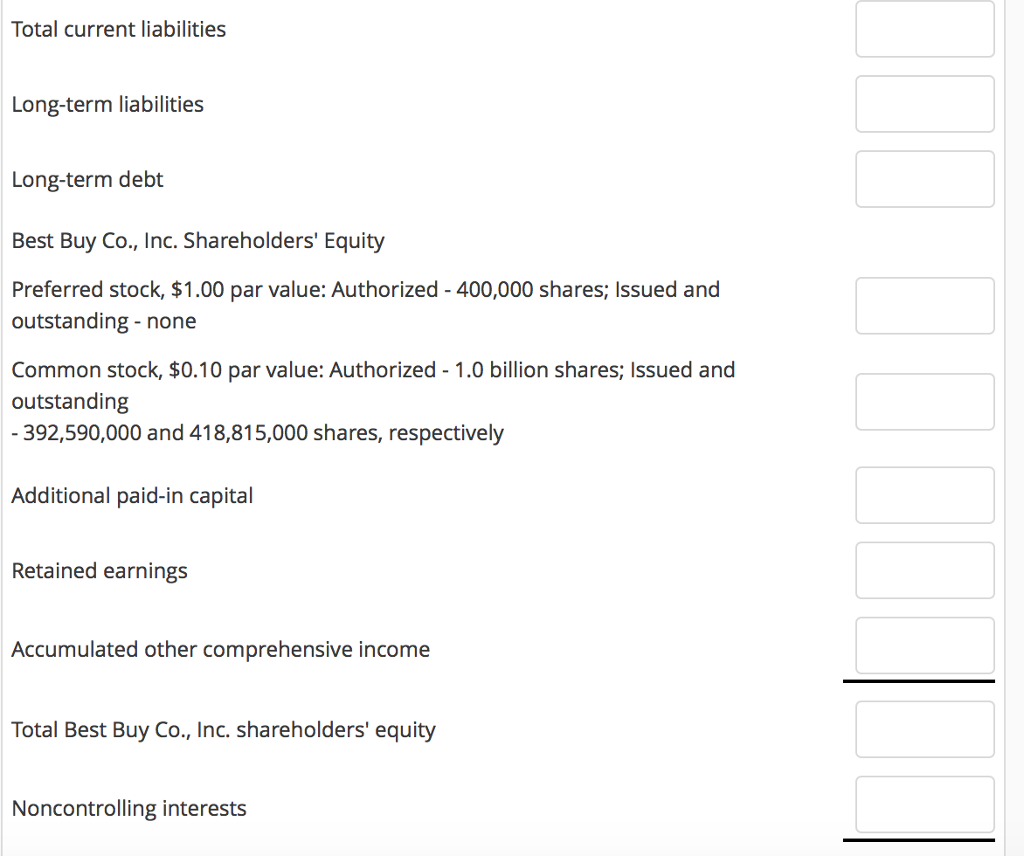
Analyzing, Forecasting, and Interpreting Both Income Statement and Balance Sheet Following are the income statements and balance sheets of Best Buy Co., Ind. Income Statement, Fiscal Years Ended ($ millions) Feb. 26, 2011 $50,272 37,611 24 Feb. 27, 2010 Revenue Cost of goods sold Restructuring charges - cost of goods sold Gross profit Selling, general and administrative expenses Restructuring charges Goodwill and tradename impairment Operating income Other income (expenses) Investment income and other Interest expense Earnings before income tax expense and equity in income of affiliates Income tax expense Equity in income of affiliates Net earnings including noncontrolling interests Net earnings attributable to noncontrolling interests Net earnings attributable to Best Buy Co., Inc. $ 49,694 37,534 12,637 10,325 198 12,160 9,873 52 2,114 2,235 51 (87) 2,078 714 54 (94) 2,195 802 1 ,366 (89) $1,277 1,394 (77) $1,317 Analyzing, Forecasting, and Interpreting Both Income Statement and Balance Sheet Following are the income statements and balance sheets of Best Buy Co., Ind. Income Statement, Fiscal Years Ended ($ millions) Feb. 26, 2011 $50,272 37,611 24 Feb. 27, 2010 Revenue Cost of goods sold Restructuring charges - cost of goods sold Gross profit Selling, general and administrative expenses Restructuring charges Goodwill and tradename impairment Operating income Other income (expenses) Investment income and other Interest expense Earnings before income tax expense and equity in income of affiliates Income tax expense Equity in income of affiliates Net earnings including noncontrolling interests Net earnings attributable to noncontrolling interests Net earnings attributable to Best Buy Co., Inc. $ 49,694 37,534 12,637 10,325 198 12,160 9,873 52 2,114 2,235 51 (87) 2,078 714 54 (94) 2,195 802 1 ,366 (89) $1,277 1,394 (77) $1,317
Step by Step Solution
There are 3 Steps involved in it

Get step-by-step solutions from verified subject matter experts