

Question: Analyzing rheological data from a rotating viscometer A study reports experimental values of shear stress vs. shear rate obtained using a rotating viscometer. The values
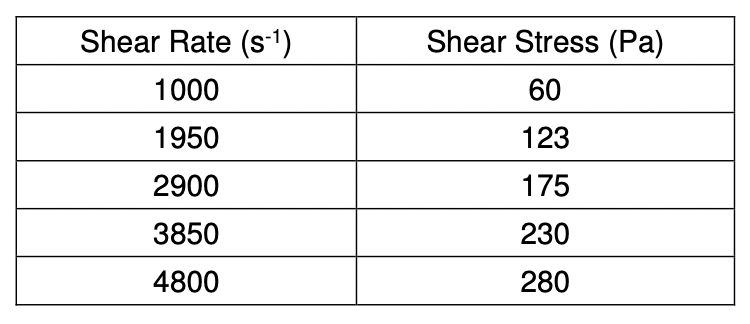
Analyzing rheological data from a rotating viscometer A study reports experimental values of shear stress vs. shear rate obtained using a rotating viscometer. The values for rice bran oil are given in the following table.
Fit the Newtonian model to this data by doing a linear regression. Make sure you anchor the line so that it passes through (0,0). In other words, make sure the model you fit has no intercept.
a. Plot both the experimental data (as symbols) and the adjusted model (as a straight line). Include the graph in your homework. b. Report the adjusted equation and the corresponding determination coefficient (R2). c. Determine if rice bran oil is a Newtonian fluid. We will assume that if the determination coefficient (R2) is greater than 0.98, the fit was reasonable and therefore data can be said to have a linear tendency. d. Report the value of viscosity in Pa-s.
Shear Stress (Pa) Shear Rate (S-1) 1000 60 1950 123 2900 175 3850 230 4800 280
Step by Step Solution
There are 3 Steps involved in it

Get step-by-step solutions from verified subject matter experts