

Question: Analyzing the following data set and answer this question: When creating a regression in EXCEL, where does the dependent variable go on the chart to
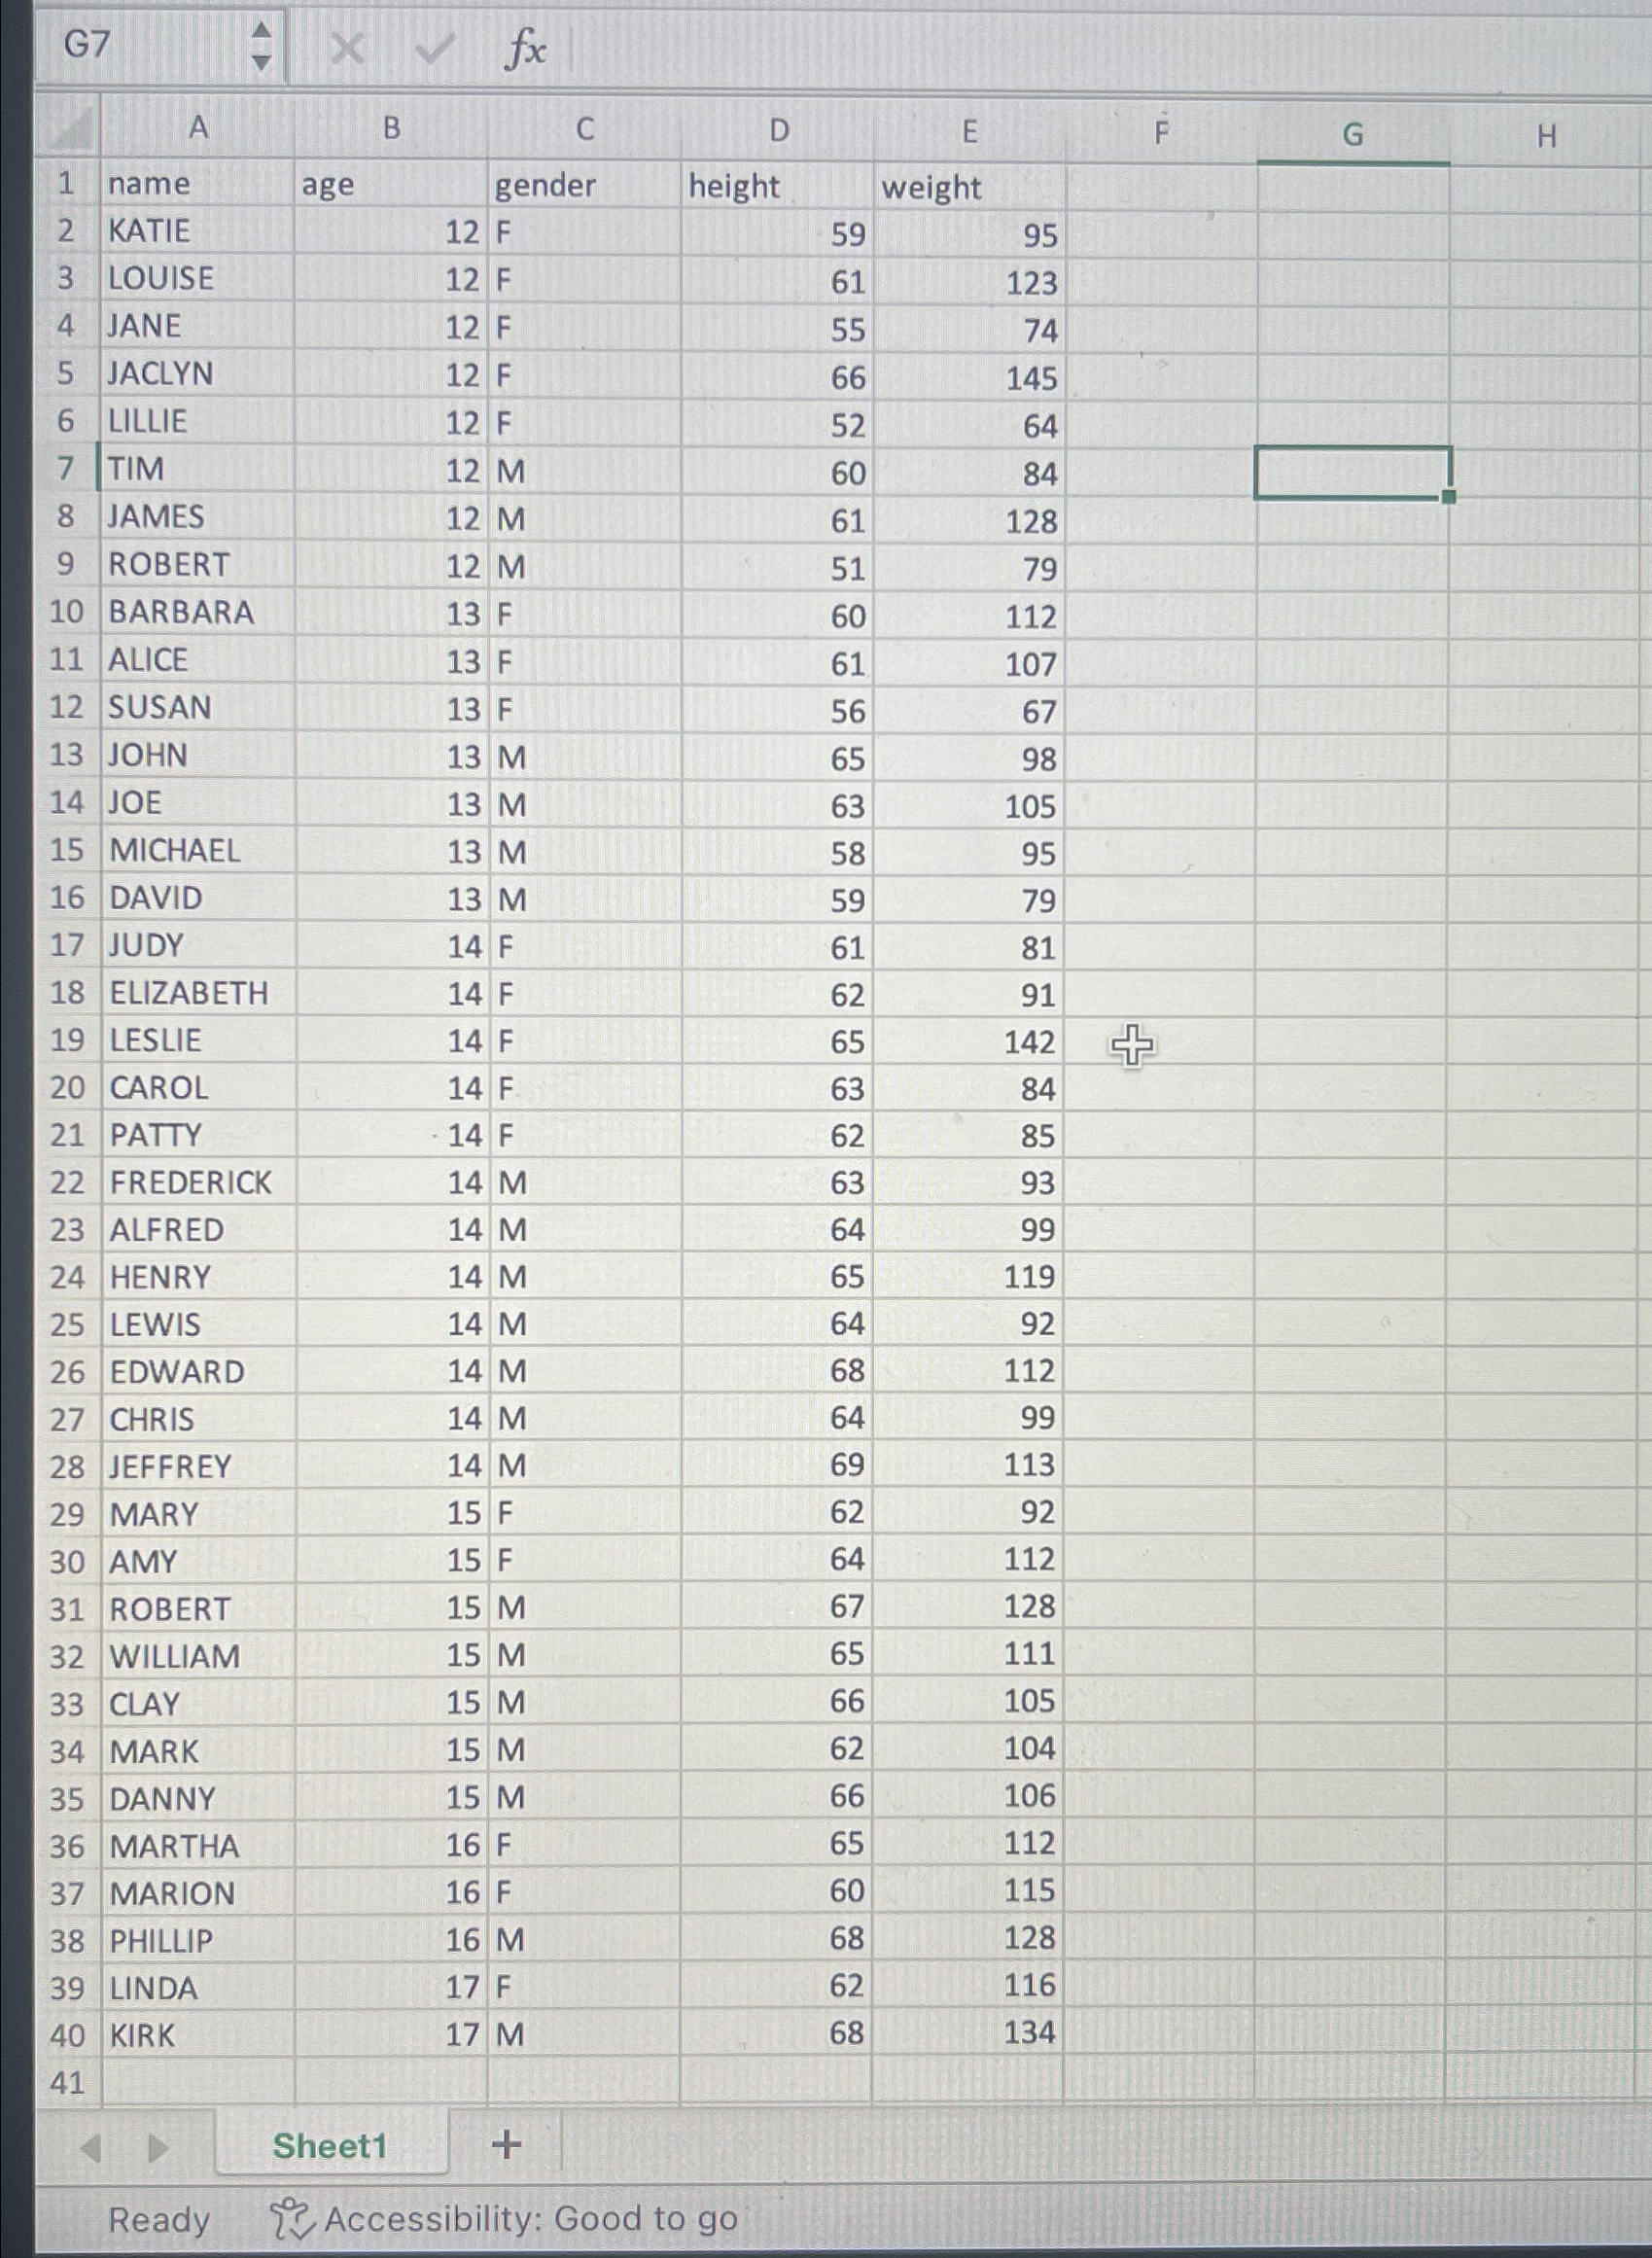
Analyzing the following data set and answer this question: When creating a regression in EXCEL, where does the dependent variable go on the chart to create your regression analysis?Data for Test xlsx
Last column on the right
You don't have to recorganize columns
First column on the left
In the middle column
Step by Step Solution
There are 3 Steps involved in it
1 Expert Approved Answer
Step: 1 Unlock

Question Has Been Solved by an Expert!
Get step-by-step solutions from verified subject matter experts
Step: 2 Unlock
Step: 3 Unlock