

Question: And Lower Control limit The overall average on a process you are attempting to monitor is 60.0 units. The process population standard deviation is 172.
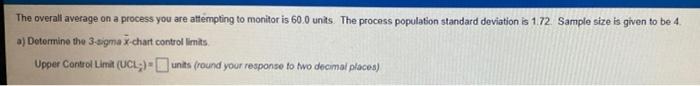
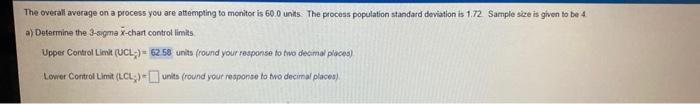
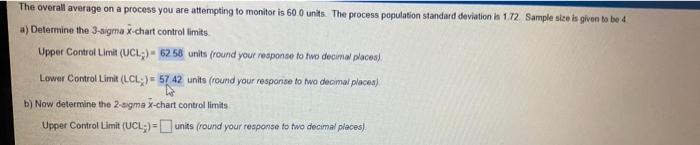
And Lower Control limit
Step by Step Solution
There are 3 Steps involved in it
1 Expert Approved Answer
Step: 1 Unlock

Question Has Been Solved by an Expert!
Get step-by-step solutions from verified subject matter experts
Step: 2 Unlock
Step: 3 Unlock