Question: and which performs more efficiently In 2014, Company A reported profits of about 544 bilion on sales of $321 billion. For that same period, Company
and which performs more efficiently
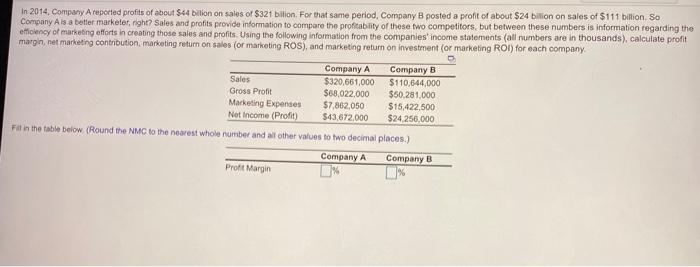
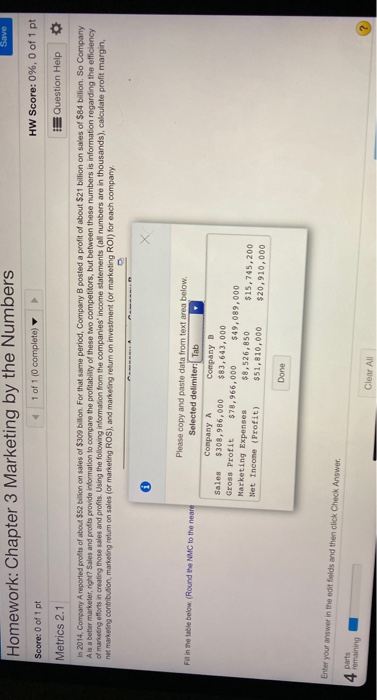
In 2014, Company A reported profits of about 544 bilion on sales of $321 billion. For that same period, Company B posted a profit of about $24 bilion on sales of $111 billion. So Company Als a better marketer, right? Sales and profits provide information to compare the profitability of these two competitors, but between these numbers is information regarding the efficiency of marketing efforts in creating those sales and profits. Using the following information from the companies'income statements (all numbers are in thousands), calculate profit margin, net marketing contribution, marketing return on sales (or marketing ROS), and marketing return on investment (or marketing ROI) for each company Company A Company B Sales $320,661,000 $110.644,000 Gross Profit $68,022,000 $50.281,000 Marketing Expenses $7.862,050 $15,422,500 Net Income (Profit) $43,672,000 $24.256,000 Fill in the table below. (Round the NMC to the nearest whole number and all other values to two decimal places) Company A Company B Profit Margin Homework: Chapter 3 Marketing by the Numbers Save Score: 0 of 1 pt 1 of 1 (0 complete) HW Score: 0%, 0 of 1 pt Metrics 2.1 Question Help In 2014, Company A reported profits of about $52 bilion on sales of $309 billion. For that same period, Company B posted a profit of about $21 billion on sales of $84 billion. So Company A is a better marketer, right? Sales and profits provide information to compare the profitability of these two competitors, but between these numbers is information regarding the efficiency of marketing efforts in creating those sales and profits. Using the following information from the companies'income statements (all numbers are in thousands), calculate profit margin, net marketing contribution, marketing return on sales (or marketing ROS), and marketing return on investment (or marketing ROI) for each company. Fill in the table below. (Round the NMC to the neare Please copy and paste data from text area below. Selected delimiter: Tab Company A Company B Sales $308,986,000 $83,643,000 Gross Profit $78,966,000 $49,089,000 Marketing Expenses $8,526,850 $15,745,200 Net Income (Profit) $51,810,000 $20, 910,000 Done Enter your answer in the edit fields and then click Check Answer 4 parts Clear All