

Question: Annotate the output as a report to include any bibliographic citation, any interesting information you found, and your interpretation of each summary. Follow proper APA
- Annotate the output as a report to include any bibliographic citation, any interesting information you found, and your interpretation of each summary. Follow proper APA style and citations in this report.
- Generate frequency tables for three categorical variables.
- Generate at least two different cross-tabulations.
- Generate a Pareto chart for the categorical variable Fam-Hist-BP.
- Find the five-number summary, mean, and standard deviation for three quantitative variables.
- Generate a side-by-side boxplot to compare the variables BP-Before-Exp and BP-After-Exp.
- Generate a histogram for each of the quantitative variables.
- Generate a scatterplot to display the relationship and find the correlation between Age and BP-Before-Exp.
- Generate a scatterplot to display the relationship and find the correlation between BP-Before-Exp and BP-After-Exp.
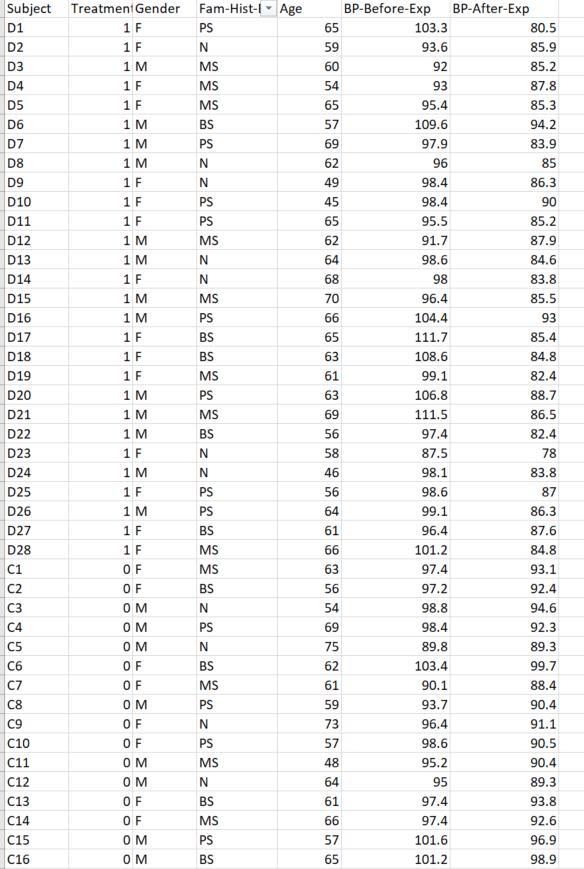
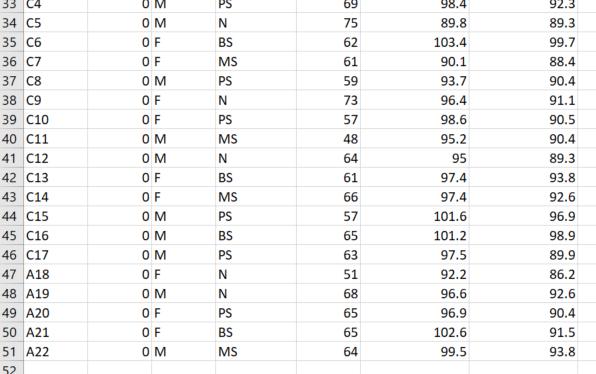
Subject Treatment Gender D1 D2 D3 D4 D5 D6 D7 D8 D9 D10 D11 D12 D13 D14 D15 D16 D17 D18 D19 D20 D21 D22 D23 D24 D25 D26 D27 D28 C5 C6 C7 C8 C9 C10 C11 C12 C13 C14 C15 C16 1 F 1 F 1 M 1 F 1 F 1 M 1 M 1 M 1 F 1 F 1 F 1 M 1 M 1 F 1 M 1 M 1 F 1 F 1 F 1 M 1 M 1 M 1 F 1 M 1 F 1 M 1 F 1 F OF OF OM OM OM OF OF OM OF OF COM OM OF OF OM OM Fam-Hist-I Age PS N MS MS MS BS PS N N PS PS MS N N MS PS BS BS MS PS MS BS N N PS PS BS MS MS BS N PS N BS MS PS N PS MS N BS MS PS BS 65 59 60 54 65 57 69 62 49 45 65 62 64 68 70 66 65 63 61 63 69 56 58 46 56 64 61 66 63 56 54 69 75 62 61 59 73 57 48 64 61 66 57 65 BP-Before-Exp BP-After-Exp 103.3 93.6 92 93 95.4 109.6 97.9 96 98.4 98.4 95.5 91.7 98.6 98 96.4 104.4 111.7 108.6 99.1 106.8 111.5 97.4 87.5 98.1 98.6 99.1 96.4 101.2 97.4 97.2 98.8 98.4 89.8 103.4 90.1 93.7 96.4 98.6 95.2 95 97.4 97.4 101.6 101.2 80.5 85.9 85.2 87.8 85.3 94.2 83.9 85 86.3 90 85.2 87.9 84.6 83.8 85.5 93 85.4 84.8 82.4 88.7 86.5 82.4 78 83.8 87 86.3 87.6 84.8 93.1 92.4 94.6 92.3 89.3 99.7 88.4 90.4 91.1 90.5 90.4 89.3 93.8 92.6 96.9 98.9
Step by Step Solution
3.30 Rating (153 Votes )
There are 3 Steps involved in it

Get step-by-step solutions from verified subject matter experts