

Question: Another possible explanatory variable for the ClassesMissed variable in the SleepStudv dataset, described in Example 1, is Drinks, the number of alcoholic drinks in a
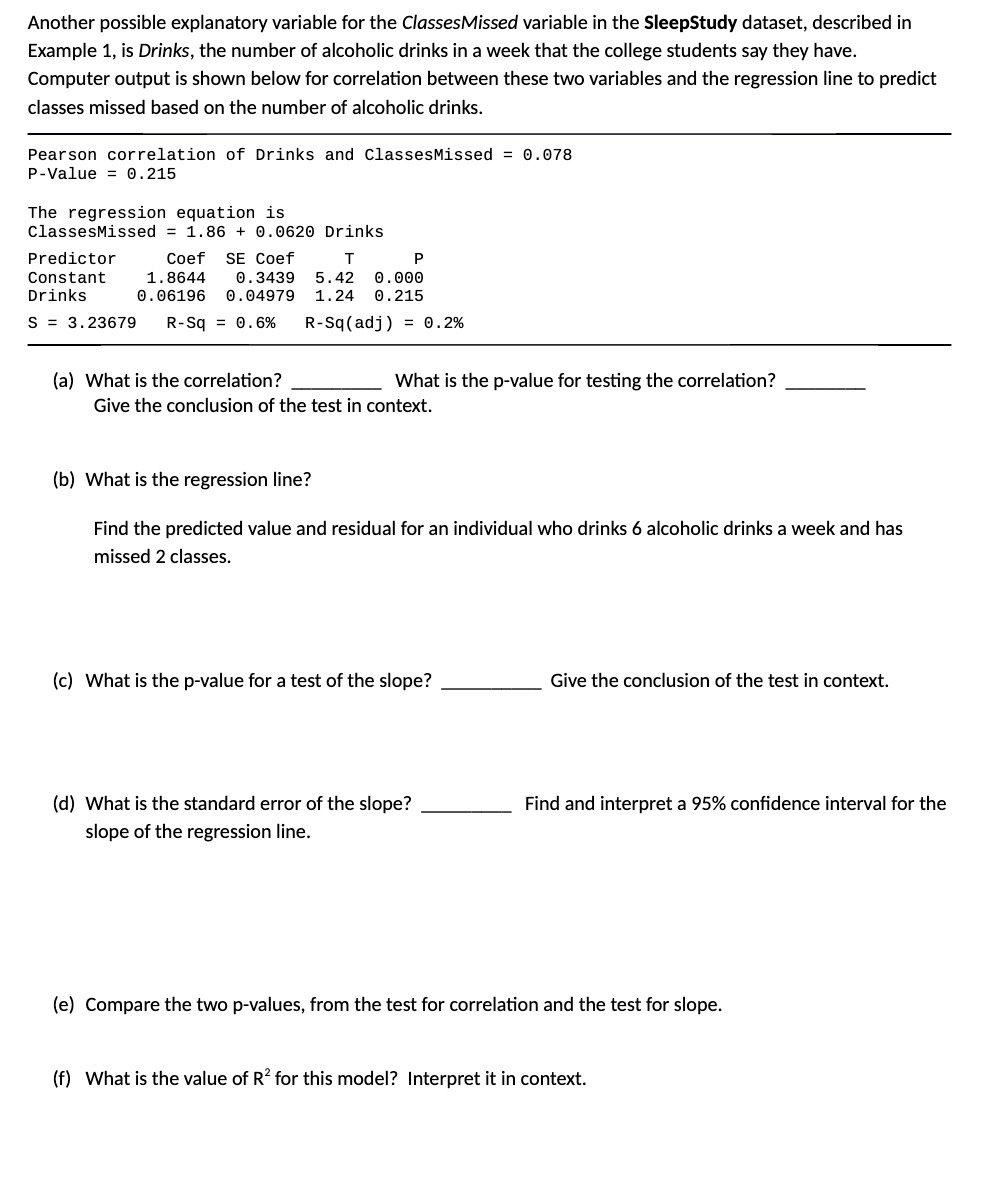
Another possible explanatory variable for the ClassesMissed variable in the SleepStudv dataset, described in Example 1, is Drinks, the number of alcoholic drinks in a week that the college students say they have. Computer output is shown below for correlation between these two variables and the regression line to predict classes missed based on the number of alcoholic drinks. Pearson correlation of Drinks and classesmissed = 8.973 P~Value = 8.215 The regression equation is Classesl-Iissed = 1.86 + 6.8623 Drinks Predictor Coef SE Coef T P Constant 1.3644 9.3439 5.42 (El . EIEIEI Drinks 9.96196 9.64979 1. 24 ( . 215 s = 3.23679 Rqu = 3.5% Rv3q(adj} = 9.2% (a) What is the correlation? What is the p-value for testing the correlation? Give the conclusion of the test in context. (b) What is the regression line? Find the predicted value and residual for an individual who drinks 6 alcoholic drinks a week and has missed 2 classes. (c) What is the p-value for a test of the slope? Give the conclusion of the test in context. (d) What is the standard error of the slope? Find and interpret a 95% condence interval for the slope of the regression line. (e) Compare the two p-values| from the test for correlation and the test for slope. (1") What is the value of R2 for this model? Interpret it in context
Step by Step Solution
There are 3 Steps involved in it

Get step-by-step solutions from verified subject matter experts