

Question: ans correctly pls 2. Use Microsoft Excel to construct an Interseparation Distance (r) vs. Energy plot, similar to Figure 7.4, for the formation of KBr.
ans correctly pls
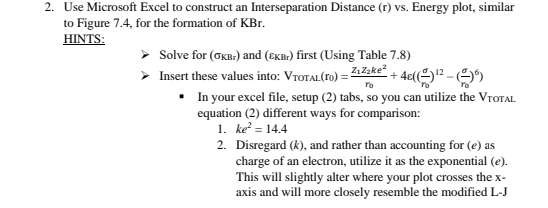
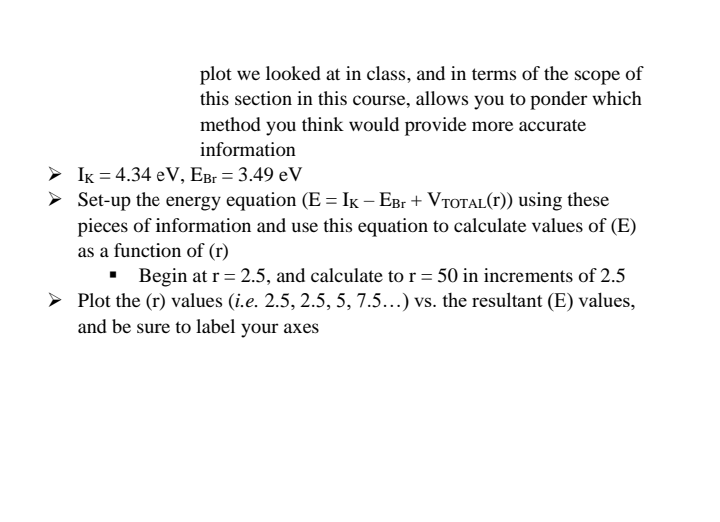
2. Use Microsoft Excel to construct an Interseparation Distance (r) vs. Energy plot, similar to Figure 7.4, for the formation of KBr. HINTS: Solve for ( KBr) and ( KBr) first (Using Table 7.8) Insert these values into: V VTOTAL (r0)=r0Z1Z2ke2+4((r0)12(r0)6) - In your excel file, setup (2) tabs, so you can utilize the VTotal. equation (2) different ways for comparison: 1. ke2=14.4 2. Disregard (k), and rather than accounting for (e) as charge of an electron, utilize it as the exponential (e). This will slightly alter where your plot crosses the x axis and will more closely resemble the modified L-J plot we looked at in class, and in terms of the scope of this section in this course, allows you to ponder which method you think would provide more accurate information IK=4.34eV,EBr=3.49eV Set-up the energy equation (E=IKEBr+VTOTAL(r)) using these pieces of information and use this equation to calculate values of (E) as a function of (r) - Begin at r=2.5, and calculate to r=50 in increments of 2.5 Plot the (r) values (i.e. 2.5, 2.5, 5, 7.5 ...) vs. the resultant (E) values, and be sure to label your axes
Step by Step Solution
There are 3 Steps involved in it

Get step-by-step solutions from verified subject matter experts