

Question: Answe all and provides steps for each one QUESTION 3: A manufacturing company keeps records of its overall annual production and its number of employees.
Answe all and provides steps for each one
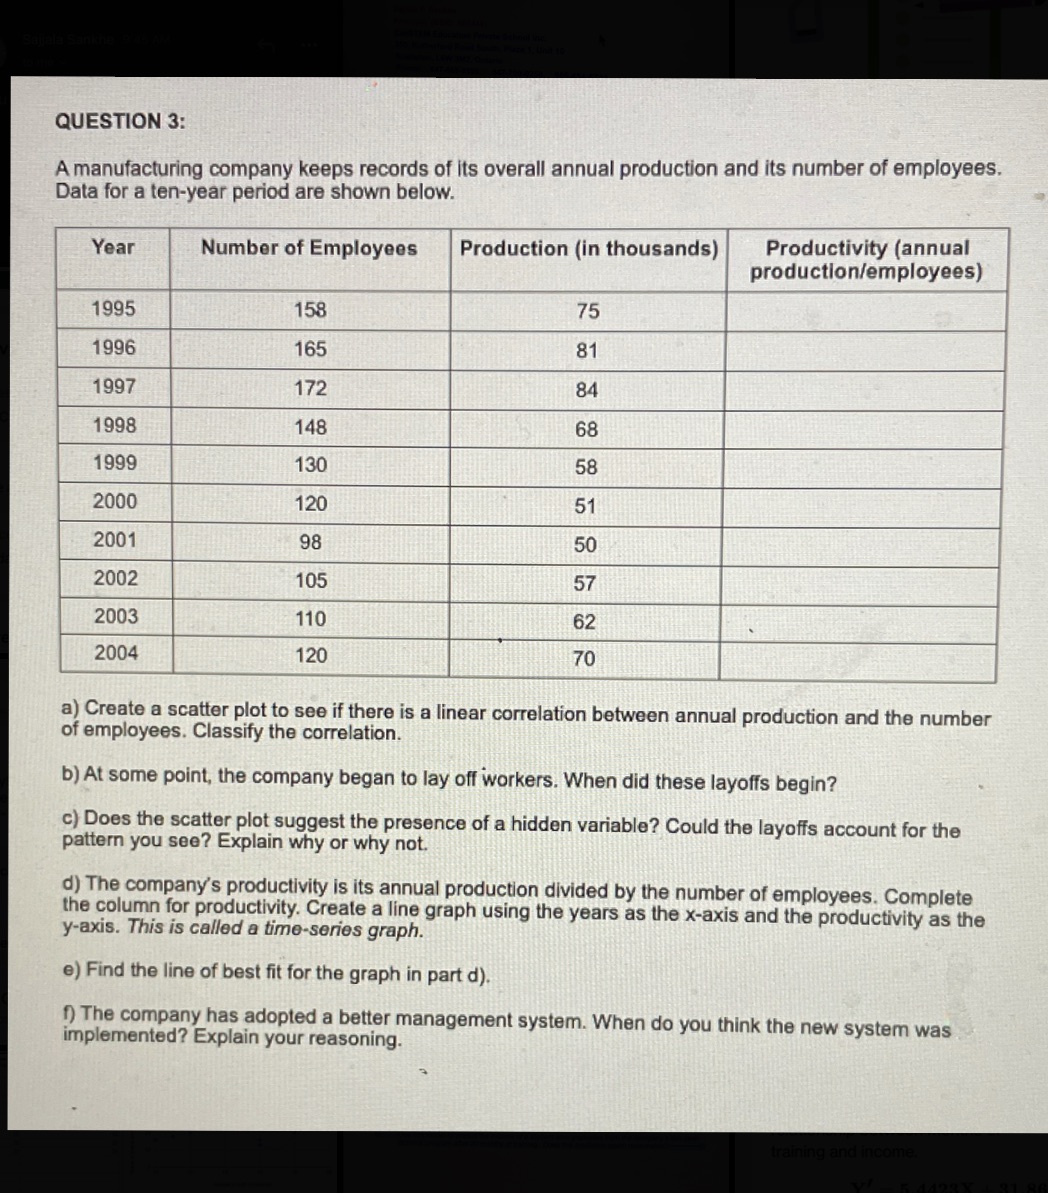
QUESTION 3: A manufacturing company keeps records of its overall annual production and its number of employees. Data for a ten-year period are shown below. Year Number of Employees Production (in thousands) Productivity (annual production/employees) 1995 158 75 1996 165 81 1997 172 84 1998 148 68 1999 130 58 2000 120 51 2001 98 50 2002 105 57 2003 110 62 2004 120 70 a) Create a scatter plot to see if there is a linear correlation between annual production and the number of employees. Classify the correlation. b) At some point, the company began to lay off workers. When did these layoffs begin? c) Does the scatter plot suggest the presence of a hidden variable? Could the layoffs account for the pattern you see? Explain why or why not. d) The company's productivity is its annual production divided by the number of employees. Complete the column for productivity. Create a line graph using the years as the x-axis and the productivity as the y-axis. This is called a time-series graph. e) Find the line of best fit for the graph in part d). () The company has adopted a better management system. When do you think the new system was implemented? Explain your reasoning
Step by Step Solution
There are 3 Steps involved in it

Get step-by-step solutions from verified subject matter experts